8-K
false000078497700007849772026-10-292026-10-29
UNITED STATES
SECURITIES AND EXCHANGE COMMISSION
Washington, D.C. 20549
FORM 8-K
CURRENT REPORT
Pursuant to Section 13 or 15(d) of The Securities Exchange Act of 1934
Date of Report (Date of earliest event reported): October 29, 2026
|
|
|
|
|
|
PORTLAND GENERAL ELECTRIC COMPANY |
(Exact name of registrant as specified in its charter) |
Oregon |
001-5532-99 |
93-0256820 |
(State or other jurisdiction of incorporation) |
(Commission File Number) |
(I.R.S. Employer Identification No.) |
121 SW Salmon Street, Portland, Oregon 97204
(Address of principal executive offices, including zip code)
Registrant’s telephone number, including area code: (503) 464-8000
Check the appropriate box below if the Form 8-K filing is intended to simultaneously satisfy the filing obligation of the registrant under any of the following provisions:
☐ Written communications pursuant to Rule 425 under the Securities Act (17 CFR 230.425)
☐ Soliciting material pursuant to Rule 14a-12 under the Exchange Act (17 CFR 240.14a-12)
☐ Pre-commencement communications pursuant to Rule 14d-2(b) under the Exchange Act (17 CFR 240.14d-2(b))
☐ Pre-commencement communications pursuant to Rule 13e-4(c) under the Exchange Act (17 CFR 240.13e-4(c))
Securities registered pursuant to Section 12(b) of the Act:
|
|
|
(Title of class) |
(Trading Symbol) |
(Name of exchange on which registered) |
Common Stock, no par value |
POR |
New York Stock Exchange |
Indicate by check mark whether the registrant is an emerging growth company as defined in Rule 405 of the Securities Act of 1933 or Rule 12b-2 of the Securities Exchange Act of 1934.
Emerging growth company ☐
If an emerging growth company, indicate by check mark if the registrant has elected not to use the extended transition period for complying with any new or revised financial accounting standards provided pursuant to Section 13(a) of the Exchange Act. [ ]
Item 2.02 Results of Operations and Financial Condition.
The following information is furnished pursuant to Item 2.02.
On October 29, 2026, Portland General Electric Company (the Company) issued a press release announcing its financial results for the three and nine months ended September 30, 2026. The press release is furnished herewith as Exhibit 99.1 to this Report.
Item 7.01 Regulation FD Disclosure.
The following information is furnished pursuant to Item 7.01.
At 11:00 a.m. ET on Thursday, October 29, 2026, the Company will hold its quarterly earnings call and webcast, and will use a slide presentation in conjunction with the earnings call. A copy of the slide presentation is furnished herewith as Exhibit 99.2 to this Report.
Item 9.01 Financial Statements and Exhibits.
SIGNATURE
Pursuant to the requirements of the Securities Exchange Act of 1934, the registrant has duly caused this report to be signed on its behalf by the undersigned thereunto duly authorized.
|
|
|
|
|
|
|
|
|
PORTLAND GENERAL ELECTRIC COMPANY |
|
|
|
|
(Registrant) |
|
|
|
|
|
Date: |
October 29, 2026 |
|
By: |
/s/ Joseph R. Trpik |
|
|
|
|
Joseph R. Trpik |
|
|
|
|
Senior Vice President, Finance and Chief Financial Officer |
EX-99.1
Exhibit 99.1
|
|
|

|
Portland General Electric One World Trade Center
121 S.W. Salmon Street
Portland, OR 97204 News Release |
|
|
|
|
October 29, 2026 |
|
|
|
|
|
Media Contact: |
|
Investor Contact: |
Drew Hanson |
|
Erin Schwartz |
Corporate Communications |
|
Investor Relations |
Phone: 503-464-2067 |
|
Phone: 503-464-7751 |
Portland General Electric Announces Third Quarter 2026 Results
•Third-quarter adjusted EPS of $1.06 reflects the unfavorable impact of historically mild weather
•Industrial customer demand grew 9% year over year, driven by continued growth from high-tech and data center customers
•Revising 2026 adjusted earnings guidance to $3.18 to $3.28 per diluted share, due to the impact of unusually mild weather during the third quarter; long-term guidance remains intact
PORTLAND, Oregon -- Portland General Electric Company (NYSE: POR) today reported third quarter 2026 net income of $119 million, or $1.00 per diluted share, on a generally accepted accounting principles (GAAP) basis. After adjusting for business transformation, optimization and acquisition expenses, third quarter 2026 non-GAAP net income was $125 million, or $1.06 per diluted share. This compares with third quarter 2025 GAAP net income of $103 million, or $0.94 per diluted share, and non-GAAP net income of $110 million, or $1.00 per diluted share.
“We continue to execute on our strategic priorities. Industrial demand grew 9% on a weather-adjusted basis year over year, and cooler summer weather reduced residential and small-commercial demand,” said Maria Pope, President and CEO. “Our October 1st go-live of the Extended Day-Ahead Market is reducing power-costs and energy market volatility, delivering an estimated $14 million in customer savings in 2027.”
Third Quarter 2026 Earnings Compared to Third Quarter 2025 Earnings
On an adjusted basis, third quarter earnings reflected continued execution on cost management initiatives, regulatory recovery and strong industrial load growth, partially offset by the impact of the mildest third quarter in a decade. Unfavorable weather reduced customer demand, resulting in a $0.15 year-over-year EPS headwind in the third quarter. On a year-to-date basis, weather has resulted in an estimated $0.20 EPS headwind relative to normal weather.
Additional Company Updates
Corporate Structure / Holding Company Update
Following the OPUC's September 25th order, the company filed a request for clarification and changes to two conditions. The proposed structure is intended to enhance financial flexibility while maintaining strong customer protections and utility financial strength. PGE's growth strategy, capital investment plan and earnings outlook do not depend on holding company implementation. The company supports $78 million in customer rate credits and $5 million in other community commitments.
Extended Day-Ahead Market
PGE successfully launched participation in the Extended Day-Ahead Market (EDAM) on October 1st, enabling lower power costs and enhanced tools to manage energy market volatility. PGE expects participation to provide meaningful customer value, including approximately $14 million in estimated customer savings in 2027.
General Rate Case
PGE filed its 2027 general rate case with the OPUC in August. As proposed, the case would result in an approximately 4.8% overall increase relative to currently approved prices with residential customers seeing an approximate 3.9% increase. If approved, new rates would take effect July 1, 2027. The increase is expected to be partially offset by lower net variable power costs in 2027, which are addressed separately through the Annual Power Cost Update Tariff. Parties’ opening testimony in the case is expected in mid-December.
Resource Planning and Procurement
In October, PGE filed its 2026 Clean Energy Plan and Integrated Resource Plan with the OPUC, proposing two pathways to meet projected resource needs while maintaining reliability and advancing Oregon’s decarbonization goals. Additionally, the company signed build-transfer agreements for two new solar and battery projects: a combined 200 MW solar and 250 MW battery storage facility at Biglow, selected from the 2025 RFP final shortlist, with an anticipated investment of approximately $900 million (excluding AFUDC); and Salmonfly, a combined 199 MW solar and 199 MW battery storage facility being developed with the Confederated Tribes of Warm Springs, with an anticipated investment of approximately $853 million (excluding AFUDC). The project was executed outside the 2025 RFP and remains subject to OPUC process as detailed in PGE's request for a waiver to the competitive bidding rules.
Quarterly Dividend
As previously announced on October 23, 2026, the board of directors of Portland General Electric Company declared a quarterly common stock dividend of 55.125 cents per share. The dividend is payable on or before January 15, 2027, to shareholders of record at the close of business on December 22, 2026.
2026 Earnings Guidance
PGE is revising its full-year 2026 adjusted earnings guidance to $3.18 to $3.28 per diluted share based on the following assumptions:
•An increase in energy deliveries between 1.0% and 2.0%, weather adjusted;
•Execution of power cost and financing plans;
•Execution of operating cost management plan;
•Normal temperatures in its utility service area for November and December;
•Hydro conditions for the year that reflect current estimates;
•Wind generation based on five years of historical levels or forecast studies when historical data is not available;
•Normal thermal plant operations;
•Operating and maintenance expense between $810 million and $830 million which includes approximately $160 million of wildfire, vegetation management, deferral amortization and other expenses that are offset in other income statement lines and $28 million of business transformation, optimization and acquisition expenses and $4 million of regulatory deferral adjustments related to the January 2024 storm and 2024 reliability contingency event;
•Depreciation and amortization expense between $570 million and $590 million;
•Effective tax rate of 15% to 20%;
•Cash from operations of $950 to $1,150 million;
•Capital expenditures of $1,565 million; and
•Average construction work in progress balance of $815 million.
Third Quarter 2026 Earnings Call and Webcast — October 29, 2026
PGE will host a conference call with financial analysts and investors on Thursday, October 29, 2026, at 11 a.m. ET. The conference call will be webcast live on the PGE website at investors.portlandgeneral.com. A webcast replay will also be available on PGE's investor website “Events & Presentations” page beginning at 2 p.m. ET on October 29, 2026.
Maria Pope, President and CEO; Joe Trpik, Senior Vice President of Finance and CFO; and Erin Schwartz, Senior Manager of Investor Relations, will participate in the call. Management will respond to questions following formal comments.
Non-GAAP Financial Measures
This press release contains certain non-GAAP measures, such as adjusted earnings, adjusted EPS and adjusted earnings guidance. These non-GAAP financial measures exclude significant items that are generally not related to our ongoing business activities, are infrequent in nature, or both. PGE believes that excluding the effects of these items provides an alternative measure of the Company’s comparative earnings per share and enables investors to evaluate the Company’s operating financial performance trends, exclusive of items that are not normally associated with ongoing operations. Management utilizes non-GAAP measures to assess the Company’s current and forecasted performance, and for communications with shareholders, analysts and investors. Non-GAAP financial measures are supplementary information that should be considered in addition to, but not as a substitute for, the information prepared in accordance with GAAP.
Items in the periods presented, which PGE believes impact the comparability of comparative earnings and do not represent ongoing operating financial performance, include the following:
•Business transformation and optimization expenses, including strategic advisory, workforce realignment, corporate structure update costs and Washington acquisition related expenses including legal, financing and strategic advisory costs.
Due to the forward-looking nature of PGE’s non-GAAP adjusted earnings guidance, and the inherently unpredictable nature of items and events which could lead to the recognition of non-GAAP adjustments (such as, but not limited to, regulatory disallowances or extreme weather events), management is unable to estimate the occurrence or value of
specific items requiring adjustment for future periods, which could potentially impact the Company’s GAAP earnings. Therefore, management cannot provide a reconciliation of non-GAAP adjusted earnings per share guidance to the most comparable GAAP financial measure without unreasonable effort. For the same reasons, management is unable to address the probable significance of unavailable information.
PGE’s reconciliation of non-GAAP earnings for the quarter ended September 30, 2026 is below.
Non-GAAP Earnings Reconciliation for the quarter ended September 30, 2026
|
|
|
(Dollars in millions, except EPS) |
Net Income |
Diluted EPS |
GAAP as reported for the quarter ended September 30, 2026 |
$ 119 |
$ 1.00 |
Exclusion of business transformation, optimization and acquisition expenses |
9 |
0.08 |
Tax effect (1) |
(3) |
(0.02) |
Non-GAAP as reported for the quarter ended September 30, 2026 |
$ 125 |
$ 1.06 |
(1) Tax effects were determined based on the Company’s full-year blended federal and state statutory rate.
# # #
About Portland General Electric Company
Portland General Electric (NYSE: POR) is an integrated energy company that generates, transmits and distributes electricity to nearly 960,000 customers serving an area of approximately 2 million Oregonians. Since 1889, Portland General Electric (PGE) has been powering economies, delivering safe, affordable and reliable electricity while working to transform energy systems to meet evolving customer needs. PGE continues to make progress towards emissions reduction targets, and customers have set the standard for prioritizing clean energy with the No. 1 voluntary renewable energy program in the country. PGE is ranked a top ten utility in the 2025 Forrester U.S. Customer Experience Index. In 2025, PGE employees and retirees volunteered over 18,300 hours to more than 400 nonprofits organizations. Through the PGE Foundation, along with corporate contributions and the employee matching gift program, more than $5 million was directed to charitable organizations supporting economic growth and community resilience across our service area. For information: portlandgeneral.com/news.
Safe Harbor Statement
Statements in this press release that relate to future plans, objectives, expectations, performance, events and the like may constitute “forward-looking statements” within the meaning of the Private Securities Litigation Reform Act of 1995, Section 27A of the Securities Act of 1933, as amended, and Section 21E of the Securities Exchange Act of 1934, as amended. These forward-looking statements represent our estimates and assumptions as of the date of this press release, and PGE assumes no obligation to update or revise any forward-looking statement as a result of new information, future events or other factors, except as required by law. Investors should not rely unduly on any forward-looking statements.
Forward-looking statements include statements, other than statements of historical or current fact, regarding PGE's earnings guidance (including all the assumptions and expectations upon which such guidance is based), expected customer demand and load growth, including industrial and data -center growth; the effects of weather on demand and earnings; expected benefits and customer savings from participation in the Extended Day-Ahead Market; PGE's proposed holding company reorganization; PGE's proposed purchase of electric utility operations and certain assets in Washington state from PacifiCorp (Acquisition), the 2027 general rate case; resource planning, procurement and capital investment, including the Biglow and Salmonfly projects; financing and operating plans, and expected dividends, as well as other statements containing words such as “anticipates,” “assumptions,” “believes,” “continue,” “could,” “estimates,” “expected,” “forecast,” “guidance,” “intended,” “may,” “outlook,” “plans,” “potentially,” “proposed,” “should,” “target,” “will,” and “working to” or similar expressions.
Forward-looking statements are inherently subject to risks and uncertainties, some of which cannot be predicted or quantified, which could cause future events and actual results to differ materially from those set forth in, contemplated by, or underlying the forward-looking statements. Such risks, uncertainties and other factors include, without limitation: wildfire and public safety risks, including the effectiveness of mitigation, vegetation management, system hardening, and public safety power shutoffs (PSPS), related liability, insurance and regulatory cost recovery; severe or unseasonable weather, climate, and catastrophe risks that may materially affect customer demand, operations, power and fuel availability, costs and cost recovery; electric-system operation, generation and energy-market risks, including outages, equipment failures, hydro and wind variability, fuel or transmission constraints, counterparty performance, and volatility in wholesale power and fuel prices; regulatory, legislative and policy risks, including the timing and outcome of rate cases, new or revised laws, regulations, executive actions, audits, investigations, and cost-recovery proceedings that could affect rates, operations, capital resource plans or financial results; Acquisition and corporate-structure risks, including approvals and conditions, financing and joint‑venture arrangements, implementation and integration, cost recovery, customer commitments, and the possibility that anticipated benefits are delayed, reduced or not realized; capital-investment and resource procurement risks, including permitting and interconnection delays, supply chain constraints, inflation, labor availability, contractual disputes, counterparty failures, project performance or abandonment, and the ability to complete projects on schedule and recover costs; load growth, customer mix and demand risks, including accelerated or uneven growth from large customers such as data centers, substantial infrastructure needs, weather-driven variability, changes in residential, commercial and industrial usage patterns, and conservation, price response, distributed generation or cusotmer migration to alternative suppliers; cybersecurity, artificial intelligence, data privacy and physical security risks that could disrupt operations, damage assets or expose sensitive information; environmental, legal and litigation risks, including permitting and remediation obligations and the timing and outcome of judicial, administrative or regulatory proceedings; and financing and macroeconomic risks, including the availability and cost of capital, credit ratings, interest rates, inflation, tariffs and supply-chain or energy-market disruption arising from geopolitical events; and the other risks and uncertainties set forth in PGE’s Annual Report on Form 10‑K for the year ended December 31, 2025 and Quarterly Reports on Form 10-Q filed thereafter with the U.S. Securities and Exchange Commission.
Source: Portland General Electric Company
PORTLAND GENERAL ELECTRIC COMPANY AND SUBSIDIARIES
CONDENSED CONSOLIDATED STATEMENTS OF INCOME
(Dollars in millions, except per share amounts)
(Unaudited)
|
|
|
|
|
|
|
|
|
|
|
|
|
|
|
|
|
|
|
Three Months Ended September 30, |
|
|
Nine Months Ended September 30, |
|
|
|
2026 |
|
|
2025 |
|
|
2026 |
|
|
2025 |
|
Revenues: |
|
|
|
|
|
|
|
|
|
|
|
|
Revenues, net |
|
$ |
969 |
|
|
$ |
946 |
|
|
$ |
2,643 |
|
|
$ |
2,676 |
|
Alternative revenue programs, net of amortization |
|
|
2 |
|
|
|
6 |
|
|
|
21 |
|
|
|
11 |
|
Total revenues |
|
|
971 |
|
|
|
952 |
|
|
|
2,664 |
|
|
|
2,687 |
|
Operating expenses: |
|
|
|
|
|
|
|
|
|
|
|
|
Purchased power and fuel |
|
|
383 |
|
|
|
372 |
|
|
|
1,040 |
|
|
|
1,034 |
|
Generation, transmission and distribution |
|
|
115 |
|
|
|
112 |
|
|
|
337 |
|
|
|
336 |
|
Administrative and other |
|
|
86 |
|
|
|
99 |
|
|
|
282 |
|
|
|
291 |
|
Depreciation and amortization |
|
|
146 |
|
|
|
148 |
|
|
|
433 |
|
|
|
427 |
|
Taxes other than income taxes |
|
|
54 |
|
|
|
47 |
|
|
|
157 |
|
|
|
139 |
|
Total operating expenses |
|
|
784 |
|
|
|
778 |
|
|
|
2,249 |
|
|
|
2,227 |
|
Income from operations |
|
|
187 |
|
|
|
174 |
|
|
|
415 |
|
|
|
460 |
|
Interest expense, net |
|
|
62 |
|
|
|
60 |
|
|
|
183 |
|
|
|
173 |
|
Other income: |
|
|
|
|
|
|
|
|
|
|
|
|
Allowance for equity funds used during construction |
|
|
8 |
|
|
|
4 |
|
|
|
17 |
|
|
|
15 |
|
Miscellaneous income, net |
|
|
5 |
|
|
|
5 |
|
|
|
23 |
|
|
|
17 |
|
Other income, net |
|
|
13 |
|
|
|
9 |
|
|
|
40 |
|
|
|
32 |
|
Income before income tax expense |
|
|
138 |
|
|
|
123 |
|
|
|
272 |
|
|
|
319 |
|
Income tax expense |
|
|
19 |
|
|
|
20 |
|
|
|
40 |
|
|
|
54 |
|
Net income |
|
|
119 |
|
|
|
103 |
|
|
|
232 |
|
|
|
265 |
|
Other comprehensive income |
|
|
1 |
|
|
|
1 |
|
|
|
1 |
|
|
|
1 |
|
Comprehensive income |
|
$ |
120 |
|
|
$ |
104 |
|
|
$ |
233 |
|
|
$ |
266 |
|
|
|
|
|
|
|
|
|
|
|
|
|
|
Weighted-average common shares outstanding (in thousands): |
|
|
|
|
|
|
|
|
|
|
|
|
Basic |
|
|
118,199 |
|
|
|
110,170 |
|
|
|
116,534 |
|
|
|
109,708 |
|
Diluted |
|
|
118,671 |
|
|
|
110,416 |
|
|
|
117,085 |
|
|
|
109,958 |
|
|
|
|
|
|
|
|
|
|
|
|
|
|
Earnings per share: |
|
|
|
|
|
|
|
|
|
|
|
|
Basic |
|
$ |
1.01 |
|
|
$ |
0.94 |
|
|
$ |
1.99 |
|
|
$ |
2.42 |
|
Diluted |
|
$ |
1.00 |
|
|
$ |
0.94 |
|
|
$ |
1.98 |
|
|
$ |
2.41 |
|
PORTLAND GENERAL ELECTRIC COMPANY AND SUBSIDIARIES
CONDENSED CONSOLIDATED BALANCE SHEETS
(In millions)
(Unaudited)
|
|
|
|
|
|
|
|
|
|
|
September 30, 2026 |
|
|
December 31, 2025 |
|
ASSETS |
|
|
|
|
|
|
Current assets: |
|
|
|
|
|
|
Cash and cash equivalents |
|
$ |
69 |
|
|
$ |
76 |
|
Accounts receivable, net |
|
|
442 |
|
|
|
460 |
|
Inventories |
|
|
127 |
|
|
|
124 |
|
Regulatory assets—current |
|
|
257 |
|
|
|
168 |
|
Other current assets |
|
|
150 |
|
|
|
244 |
|
Total current assets |
|
|
1,045 |
|
|
|
1,072 |
|
Electric utility plant, net |
|
|
11,712 |
|
|
|
10,993 |
|
Regulatory assets—noncurrent |
|
|
513 |
|
|
|
619 |
|
Nuclear decommissioning trust |
|
|
44 |
|
|
|
42 |
|
Non-qualified benefit plan trust |
|
|
38 |
|
|
|
36 |
|
Other noncurrent assets |
|
|
463 |
|
|
|
468 |
|
Total assets |
|
$ |
13,815 |
|
|
$ |
13,230 |
|
PORTLAND GENERAL ELECTRIC COMPANY AND SUBSIDIARIES
CONDENSED CONSOLIDATED BALANCE SHEETS, continued
(In millions, except share amounts)
(Unaudited)
|
|
|
|
|
|
|
|
|
|
|
September 30, 2026 |
|
|
December 31, 2025 |
|
LIABILITIES AND SHAREHOLDERS’ EQUITY |
|
|
|
|
|
|
Current liabilities: |
|
|
|
|
|
|
Accounts payable |
|
$ |
310 |
|
|
$ |
330 |
|
Liabilities from price risk management activities—current |
|
|
113 |
|
|
|
158 |
|
Current portion of finance lease obligation |
|
|
27 |
|
|
|
27 |
|
Accrued expenses and other current liabilities |
|
|
462 |
|
|
|
478 |
|
Total current liabilities |
|
|
912 |
|
|
|
993 |
|
Long-term debt, net of current portion |
|
|
5,010 |
|
|
|
4,662 |
|
Regulatory liabilities—noncurrent |
|
|
1,524 |
|
|
|
1,490 |
|
Deferred income taxes |
|
|
668 |
|
|
|
601 |
|
Deferred investment tax credits |
|
|
187 |
|
|
|
194 |
|
Unfunded status of pension and postretirement plans |
|
|
89 |
|
|
|
107 |
|
Liabilities from price risk management activities—noncurrent |
|
|
49 |
|
|
|
56 |
|
Asset retirement obligations |
|
|
302 |
|
|
|
299 |
|
Non-qualified benefit plan liabilities |
|
|
66 |
|
|
|
70 |
|
Finance lease obligations, net of current portion |
|
|
253 |
|
|
|
263 |
|
Other noncurrent liabilities |
|
|
423 |
|
|
|
362 |
|
Total liabilities |
|
|
9,483 |
|
|
|
9,097 |
|
Commitments and contingencies (see notes) |
|
|
|
|
|
|
Shareholders’ Equity: |
|
|
|
|
|
|
Preferred stock, no par value, 30,000,000 shares authorized; none issued and outstanding as of September 30, 2026 and December 31, 2025 |
|
|
— |
|
|
|
— |
|
Common stock, no par value, 160,000,000 shares authorized; 118,907,598 and 115,559,079 shares issued and outstanding as of September 30, 2026 and December 31, 2025, respectively |
|
|
2,540 |
|
|
|
2,382 |
|
Accumulated other comprehensive loss |
|
|
(3 |
) |
|
|
(4 |
) |
Retained earnings |
|
|
1,795 |
|
|
|
1,755 |
|
Total shareholders’ equity |
|
|
4,332 |
|
|
|
4,133 |
|
Total liabilities and shareholders’ equity |
|
$ |
13,815 |
|
|
$ |
13,230 |
|
PORTLAND GENERAL ELECTRIC COMPANY AND SUBSIDIARIES
CONDENSED CONSOLIDATED STATEMENTS OF CASH FLOWS
(In millions)
(Unaudited)
|
|
|
|
|
|
|
|
|
|
|
Nine Months Ended September 30, |
|
|
|
2026 |
|
|
2025 |
|
Cash flows from operating activities: |
|
|
|
|
|
|
Net income |
|
$ |
232 |
|
|
$ |
265 |
|
Adjustments to reconcile net income to net cash provided by operating activities: |
|
|
|
|
|
|
Depreciation and amortization |
|
|
433 |
|
|
|
427 |
|
Deferred income taxes |
|
|
22 |
|
|
|
39 |
|
Allowance for equity funds used during construction |
|
|
(17 |
) |
|
|
(15 |
) |
Alternative revenue programs |
|
|
(21 |
) |
|
|
(11 |
) |
Regulatory assets |
|
|
20 |
|
|
|
(6 |
) |
Regulatory liabilities |
|
|
16 |
|
|
|
(21 |
) |
Tax credit sales |
|
|
23 |
|
|
|
153 |
|
Other non-cash income and expenses, net |
|
|
78 |
|
|
|
69 |
|
Changes in working capital: |
|
|
|
|
|
|
Accounts receivable, net |
|
|
10 |
|
|
|
(9 |
) |
Inventories |
|
|
(3 |
) |
|
|
(10 |
) |
Margin deposits |
|
|
63 |
|
|
|
66 |
|
Accounts payable and accrued liabilities |
|
|
20 |
|
|
|
43 |
|
Margin deposits from wholesale counterparties |
|
|
(19 |
) |
|
|
— |
|
Other working capital items, net |
|
|
20 |
|
|
|
37 |
|
Other, net |
|
|
(66 |
) |
|
|
(57 |
) |
Net cash provided by operating activities |
|
|
811 |
|
|
|
970 |
|
Cash flows from investing activities: |
|
|
|
|
|
|
Capital expenditures |
|
|
(1,085 |
) |
|
|
(899 |
) |
Sales of Nuclear decommissioning trust securities |
|
|
3 |
|
|
|
4 |
|
Purchases of Nuclear decommissioning trust securities |
|
|
(3 |
) |
|
|
(9 |
) |
Other, net |
|
|
(18 |
) |
|
|
(12 |
) |
Net cash used in investing activities |
|
|
(1,103 |
) |
|
|
(916 |
) |
PORTLAND GENERAL ELECTRIC COMPANY AND SUBSIDIARIES
CONDENSED CONSOLIDATED STATEMENTS OF CASH FLOWS, continued
(In millions)
(Unaudited)
|
|
|
|
|
|
|
|
|
|
|
Nine Months Ended September 30, |
|
|
|
2026 |
|
|
2025 |
|
Cash flows from financing activities: |
|
|
|
|
|
|
Proceeds from issuance of common stock |
|
$ |
156 |
|
|
$ |
49 |
|
Proceeds from issuance of long-term debt |
|
|
350 |
|
|
|
310 |
|
Payments on long-term debt |
|
|
— |
|
|
|
(102 |
) |
Dividends paid |
|
|
(184 |
) |
|
|
(167 |
) |
Other |
|
|
(37 |
) |
|
|
(19 |
) |
Net cash provided by financing activities |
|
|
285 |
|
|
|
71 |
|
Change in cash and cash equivalents |
|
|
(7 |
) |
|
|
125 |
|
Cash and cash equivalents, beginning of period |
|
|
76 |
|
|
|
12 |
|
Cash and cash equivalents, end of period |
|
$ |
69 |
|
|
$ |
137 |
|
Supplemental cash flow information is as follows: |
|
|
|
|
|
|
Cash paid for interest, net of amounts capitalized |
|
$ |
155 |
|
|
$ |
146 |
|
Cash received for income taxes, net |
|
|
(3 |
) |
|
|
(137 |
) |
PORTLAND GENERAL ELECTRIC COMPANY AND SUBSIDIARIES
SUPPLEMENTAL OPERATING STATISTICS
(Unaudited)
|
|
|
|
|
|
|
|
|
|
|
|
|
|
|
|
|
|
|
|
|
|
|
|
|
|
|
|
|
|
|
|
|
|
|
Three Months Ended September 30, |
|
|
Nine Months Ended September 30, |
|
|
|
2026 |
|
|
2025 |
|
|
2026 |
|
|
2025 |
|
Retail: |
|
|
|
|
|
|
|
|
|
|
|
|
|
|
|
|
|
|
|
|
|
|
|
|
Residential |
|
$ |
362 |
|
|
|
37 |
% |
|
$ |
375 |
|
|
|
39 |
% |
|
$ |
1,090 |
|
|
|
41 |
% |
|
$ |
1,115 |
|
|
|
42 |
% |
Commercial |
|
|
261 |
|
|
|
27 |
|
|
|
262 |
|
|
|
28 |
|
|
|
744 |
|
|
|
28 |
|
|
|
738 |
|
|
|
27 |
|
Industrial |
|
|
177 |
|
|
|
18 |
|
|
|
141 |
|
|
|
15 |
|
|
|
472 |
|
|
|
17 |
|
|
|
396 |
|
|
|
15 |
|
Subtotal |
|
|
800 |
|
|
|
82 |
|
|
|
778 |
|
|
|
82 |
|
|
|
2,306 |
|
|
|
86 |
|
|
|
2,249 |
|
|
|
84 |
|
Direct access: |
|
|
|
|
|
|
|
|
|
|
|
|
|
|
|
|
|
|
|
|
|
|
|
|
Commercial |
|
|
3 |
|
|
|
— |
|
|
|
4 |
|
|
|
— |
|
|
|
10 |
|
|
|
— |
|
|
|
12 |
|
|
|
— |
|
Industrial |
|
|
10 |
|
|
|
1 |
|
|
|
7 |
|
|
|
1 |
|
|
|
24 |
|
|
|
1 |
|
|
|
18 |
|
|
|
1 |
|
Subtotal |
|
|
13 |
|
|
|
1 |
|
|
|
11 |
|
|
|
1 |
|
|
|
34 |
|
|
|
1 |
|
|
|
30 |
|
|
|
1 |
|
Subtotal Retail |
|
|
813 |
|
|
|
83 |
|
|
|
789 |
|
|
|
83 |
|
|
|
2,340 |
|
|
|
87 |
|
|
|
2,279 |
|
|
|
85 |
|
Alternative revenue programs, net of amortization |
|
|
2 |
|
|
|
— |
|
|
|
6 |
|
|
|
1 |
|
|
|
21 |
|
|
|
1 |
|
|
|
11 |
|
|
|
1 |
|
Other accrued revenues, net |
|
|
(6 |
) |
|
|
— |
|
|
|
(1 |
) |
|
|
— |
|
|
|
(11 |
) |
|
|
— |
|
|
|
9 |
|
|
|
— |
|
Total retail revenues |
|
|
809 |
|
|
|
83 |
|
|
|
794 |
|
|
|
84 |
|
|
|
2,350 |
|
|
|
88 |
|
|
|
2,299 |
|
|
|
86 |
|
Wholesale revenues |
|
|
143 |
|
|
|
15 |
|
|
|
136 |
|
|
|
14 |
|
|
|
245 |
|
|
|
9 |
|
|
|
324 |
|
|
|
12 |
|
Other operating revenues |
|
|
19 |
|
|
|
2 |
|
|
|
22 |
|
|
|
2 |
|
|
|
69 |
|
|
|
3 |
|
|
|
64 |
|
|
|
2 |
|
Total revenues |
|
$ |
971 |
|
|
|
100 |
% |
|
$ |
952 |
|
|
|
100 |
% |
|
$ |
2,664 |
|
|
|
100 |
% |
|
$ |
2,687 |
|
|
|
100 |
% |
|
|
|
|
|
|
|
|
|
|
|
|
|
|
|
|
|
|
|
|
|
|
|
|
|
|
|
|
|
|
|
|
|
|
|
Three Months Ended September 30, |
|
|
Nine Months Ended September 30, |
|
|
|
2026 |
|
|
2025 |
|
|
%
Change |
|
|
% Change (Weather- Adjusted) |
|
|
2026 |
|
|
2025 |
|
|
%
Change |
|
|
% Change (Weather- Adjusted)* |
|
Energy deliveries: |
|
|
|
|
|
|
|
|
|
|
|
|
|
|
|
|
|
|
|
|
|
|
|
|
Retail: |
|
|
|
|
|
|
|
|
|
|
|
|
|
|
|
|
|
|
|
|
|
|
|
|
Residential |
|
|
1,740 |
|
|
|
1,911 |
|
|
|
(8.9 |
)% |
|
|
(0.6 |
)% |
|
|
5,418 |
|
|
|
5,708 |
|
|
|
(5.1 |
)% |
|
|
(2.4 |
)% |
Commercial |
|
|
1,668 |
|
|
|
1,752 |
|
|
|
(4.8 |
) |
|
|
(1.8 |
) |
|
|
4,791 |
|
|
|
4,930 |
|
|
|
(2.8 |
) |
|
|
(1.8 |
) |
Industrial |
|
|
1,654 |
|
|
|
1,561 |
|
|
|
6.0 |
|
|
|
6.4 |
|
|
|
4,815 |
|
|
|
4,375 |
|
|
|
10.1 |
|
|
|
10.2 |
|
Subtotal |
|
|
5,062 |
|
|
|
5,224 |
|
|
|
(3.1 |
) |
|
|
1.1 |
|
|
|
15,024 |
|
|
|
15,013 |
|
|
|
0.1 |
|
|
|
1.5 |
|
Direct access: |
|
|
|
|
|
|
|
|
|
|
|
|
|
|
|
|
|
|
|
|
|
|
|
|
Commercial |
|
|
134 |
|
|
|
155 |
|
|
|
(13.5 |
) |
|
|
(13.5 |
) |
|
|
368 |
|
|
|
419 |
|
|
|
(12.2 |
) |
|
|
(12.2 |
) |
Industrial |
|
|
552 |
|
|
|
545 |
|
|
|
1.3 |
|
|
|
1.3 |
|
|
|
1,562 |
|
|
|
1,501 |
|
|
|
4.1 |
|
|
|
4.1 |
|
Subtotal |
|
|
686 |
|
|
|
700 |
|
|
|
(2.0 |
) |
|
|
(2.0 |
) |
|
|
1,930 |
|
|
|
1,920 |
|
|
|
0.5 |
|
|
|
0.5 |
|
Total retail |
|
|
5,748 |
|
|
|
5,924 |
|
|
|
(3.0 |
) |
|
|
0.7 |
% |
|
|
16,954 |
|
|
|
16,933 |
|
|
|
0.1 |
|
|
|
1.3 |
% |
Wholesale |
|
|
2,379 |
|
|
|
2,741 |
|
|
|
(13.2 |
) |
|
|
|
|
|
5,293 |
|
|
|
7,159 |
|
|
|
(26.1 |
) |
|
|
|
Total |
|
|
8,127 |
|
|
|
8,665 |
|
|
|
(6.2 |
)% |
|
|
|
|
|
22,247 |
|
|
|
24,092 |
|
|
|
(7.7 |
)% |
|
|
|
|
|
|
|
|
|
|
|
|
|
|
|
|
|
|
|
|
|
|
|
|
|
|
|
|
|
|
Three Months Ended September 30, |
|
|
Nine Months Ended September 30, |
|
|
|
2026 |
|
|
2025 |
|
|
% Change |
|
|
2026 |
|
|
2025 |
|
|
% Change |
|
Average number of retail customers: |
|
|
|
|
|
|
|
|
|
|
|
|
|
|
|
|
|
|
Residential |
|
|
847,007 |
|
|
|
841,257 |
|
|
|
1 |
% |
|
|
846,286 |
|
|
|
839,429 |
|
|
|
1 |
% |
Commercial |
|
|
114,495 |
|
|
|
114,258 |
|
|
|
— |
|
|
|
114,520 |
|
|
|
114,226 |
|
|
|
— |
|
Industrial |
|
|
224 |
|
|
|
218 |
|
|
|
3 |
|
|
|
222 |
|
|
|
217 |
|
|
|
2 |
|
Direct access |
|
|
497 |
|
|
|
747 |
|
|
|
(33 |
) |
|
|
511 |
|
|
|
688 |
|
|
|
(26 |
) |
Total |
|
|
962,223 |
|
|
|
956,480 |
|
|
|
1 |
% |
|
|
961,539 |
|
|
|
954,560 |
|
|
|
1 |
% |
PORTLAND GENERAL ELECTRIC COMPANY AND SUBSIDIARIES
SUPPLEMENTAL OPERATING STATISTICS, continued
(Unaudited)
|
|
|
|
|
|
|
|
|
|
|
|
|
|
|
|
|
|
|
|
|
|
|
|
|
|
|
Heating Degree-days |
|
|
Cooling Degree-days |
|
|
|
2026 |
|
|
2025 |
|
|
Avg. |
|
|
2026 |
|
|
2025 |
|
|
Avg. |
|
First Quarter |
|
|
1,737 |
|
|
|
1,772 |
|
|
|
1,828 |
|
|
|
— |
|
|
|
4 |
|
|
|
— |
|
Second Quarter |
|
|
477 |
|
|
|
464 |
|
|
|
580 |
|
|
|
133 |
|
|
|
102 |
|
|
|
115 |
|
July |
|
|
6 |
|
|
|
2 |
|
|
|
3 |
|
|
|
190 |
|
|
|
209 |
|
|
|
208 |
|
August |
|
|
2 |
|
|
|
— |
|
|
|
2 |
|
|
|
202 |
|
|
|
277 |
|
|
|
240 |
|
September |
|
|
61 |
|
|
|
17 |
|
|
|
49 |
|
|
|
23 |
|
|
|
102 |
|
|
|
92 |
|
Third Quarter |
|
|
69 |
|
|
|
19 |
|
|
|
54 |
|
|
|
415 |
|
|
|
588 |
|
|
|
540 |
|
Year-to-date |
|
|
2,283 |
|
|
|
2,255 |
|
|
|
2,462 |
|
|
|
548 |
|
|
|
694 |
|
|
|
655 |
|
(Decrease)/Increase from the 15-year average |
|
|
(7 |
)% |
|
|
(8 |
)% |
|
|
|
|
|
(16 |
)% |
|
|
6 |
% |
|
|
|
Note: “Average” amounts represent the 15-year rolling averages provided by the National Weather Service (Portland Airport).
|
|
|
|
|
|
|
|
|
|
|
|
|
|
|
|
|
|
|
|
|
|
|
|
|
|
|
|
|
|
|
|
|
|
|
Three Months Ended September 30, |
|
|
Nine Months Ended September 30, |
|
|
|
2026 |
|
|
2025 |
|
|
2026 |
|
|
2025 |
|
Generation: |
|
|
|
|
|
|
|
|
|
|
|
|
|
|
|
|
|
|
|
|
|
|
|
|
Thermal: |
|
|
|
|
|
|
|
|
|
|
|
|
|
|
|
|
|
|
|
|
|
|
|
|
Natural gas |
|
|
3,265 |
|
|
|
42 |
% |
|
|
3,138 |
|
|
|
39 |
% |
|
|
7,000 |
|
|
|
33 |
% |
|
|
8,534 |
|
|
|
38 |
% |
Coal |
|
|
544 |
|
|
|
7 |
|
|
|
581 |
|
|
|
7 |
|
|
|
1,059 |
|
|
|
5 |
|
|
|
1,408 |
|
|
|
6 |
|
Total thermal |
|
|
3,809 |
|
|
|
49 |
|
|
|
3,719 |
|
|
|
46 |
|
|
|
8,059 |
|
|
|
38 |
|
|
|
9,942 |
|
|
|
44 |
|
Hydro |
|
|
174 |
|
|
|
2 |
|
|
|
199 |
|
|
|
2 |
|
|
|
765 |
|
|
|
4 |
|
|
|
969 |
|
|
|
4 |
|
Wind |
|
|
710 |
|
|
|
9 |
|
|
|
669 |
|
|
|
8 |
|
|
|
2,025 |
|
|
|
9 |
|
|
|
2,134 |
|
|
|
9 |
|
Total generation |
|
|
4,693 |
|
|
|
60 |
|
|
|
4,587 |
|
|
|
56 |
|
|
|
10,849 |
|
|
|
51 |
|
|
|
13,045 |
|
|
|
57 |
|
Purchased power: |
|
|
|
|
|
|
|
|
|
|
|
|
|
|
|
|
|
|
|
|
|
|
|
|
Hydro |
|
|
861 |
|
|
|
11 |
|
|
|
1,549 |
|
|
|
19 |
|
|
|
3,552 |
|
|
|
17 |
|
|
|
5,321 |
|
|
|
24 |
|
Wind |
|
|
350 |
|
|
|
4 |
|
|
|
280 |
|
|
|
4 |
|
|
|
1,085 |
|
|
|
5 |
|
|
|
871 |
|
|
|
4 |
|
Solar |
|
|
668 |
|
|
|
9 |
|
|
|
399 |
|
|
|
5 |
|
|
|
1,602 |
|
|
|
8 |
|
|
|
992 |
|
|
|
4 |
|
Natural Gas |
|
|
518 |
|
|
|
7 |
|
|
|
522 |
|
|
|
7 |
|
|
|
1,142 |
|
|
|
5 |
|
|
|
522 |
|
|
|
2 |
|
Waste, Wood, and Landfill Gas |
|
|
27 |
|
|
|
— |
|
|
|
29 |
|
|
|
— |
|
|
|
76 |
|
|
|
— |
|
|
|
83 |
|
|
|
— |
|
Source not specified |
|
|
736 |
|
|
|
9 |
|
|
|
765 |
|
|
|
9 |
|
|
|
2,949 |
|
|
|
14 |
|
|
|
1,935 |
|
|
|
9 |
|
Total purchased power |
|
|
3,160 |
|
|
|
40 |
|
|
|
3,544 |
|
|
|
44 |
|
|
|
10,406 |
|
|
|
49 |
|
|
|
9,724 |
|
|
|
43 |
|
Total system load |
|
|
7,853 |
|
|
|
100 |
% |
|
|
8,131 |
|
|
|
100 |
% |
|
|
21,255 |
|
|
|
100 |
% |
|
|
22,769 |
|
|
|
100 |
% |
Less: wholesale sales |
|
|
(2,379 |
) |
|
|
|
|
|
(2,741 |
) |
|
|
|
|
|
(5,293 |
) |
|
|
|
|
|
(7,159 |
) |
|
|
|
Retail load requirement |
|
|
5,474 |
|
|
|
|
|
|
5,390 |
|
|
|
|
|
|
15,962 |
|
|
|
|
|
|
15,610 |
|
|
|
|

Portland General Electric EARNINGS CONFERENCE CALL THIRD QUARTER 2026 1 Exhibit 99.2
Cautionary statement Information Current as of October 29, 2026 Except as expressly noted, the information in this presentation is current as of October 29, 2026 – the date on which Portland General Electric Company (PGE) filed its Quarterly Report on Form 10-Q for the quarter ended September 30, 2026 - and should not be relied upon as being current as of any subsequent date. PGE undertakes no duty to update this presentation, except as may be required by law. Forward-Looking Statements Statements in this presentation that relate to future plans, objectives, expectations, performance, events and the like may constitute "forward-looking statements" within the meaning of the Private Securities Litigation Reform Act of 1995, Section 27A of the Securities Act of 1933, as amended, and Section 21E of the Securities Exchange Act of 1934, as amended. These forward-looking statements represent PGE’s estimates and assumptions as of the date of this presentation. Investors should not rely unduly on any forward-looking statements. Forward-looking statements include statements, other than statements of historical or current fact, regarding PGE’s updated 2026 earnings guidance and weather-adjusted load-growth guidance, including the assumptions and expectations upon which such guidance is based; expected fourth-quarter performance and management actions; long-term load, earnings and dividend growth; capital expenditures, rate-base growth and the timing, cost and execution of resource investments, including Biglow Optimization Phase 2 and Salmonfly; PGE’s financing, liquidity, credit-metric, equity-issuance and tax-credit monetization plans; PGE’s proposed holding-company reorganization; and the timing, approvals, financing and expected closing of PGE’s proposed acquisition of electric utility operations and certain assets in Washington state from PacifiCorp (Acquisition), as well as other statements containing words such as “assumptions,” “expected,” “forecast,” “guidance,” “may,” “outlook,” “plans,” “potential,” “projected,” “projections,” “reaffirming,” “supports,” “target,” “updating,” and “will,” or similar expressions. Forward-looking statements are inherently subject to risks and uncertainties, some of which cannot be predicted or quantified, which could cause future events and actual results to differ materially from those set forth in, contemplated by, or underlying the forward-looking statements. Such risks, uncertainties and other factors include, without limitation: wildfire and public-safety risks, including the effectiveness of mitigation, vegetation management, system hardening and public safety power shutoffs (PSPS), related liability, insurance and regulatory cost recovery; severe or unseasonable weather, climate and catastrophe risks that may materially affect customer demand, earnings, operations, power and fuel availability, costs and cost recovery; electric-system, generation and energy-market risks, including outages, equipment failures, hydro and wind variability, fuel or transmission constraints, counterparty performance and volatility in wholesale power and fuel prices; regulatory, legislative and policy risks, including the timing and outcome of rate cases, cost-recovery proceedings, permits, audits and other governmental actions affecting rates, operations, capital-resource plans or financial results; Acquisition and corporate-structure risks, including approvals and conditions, financing and joint-venture arrangements, implementation and integration, cost recovery, customer commitments, and the possibility that anticipated benefits or the target closing are delayed, reduced or not realized; capital-investment and resource-procurement risks, including permitting and interconnection delays, tariffs, supply-chain constraints, inflation, labor availability, contractual disputes, counterparty failures, changes in tax-credit availability or monetization, project performance or abandonment, and the ability to complete projects on schedule and recover costs; load-growth, customer-mix and demand risks, including accelerated or uneven growth from large customers such as data centers, substantial infrastructure needs, weather-driven variability, changes in residential, commercial and industrial usage, and conservation, price response, distributed generation or customer migration to alternative suppliers; cybersecurity, artificial-intelligence, data-privacy and physical-security risks that could disrupt operations, damage assets or expose sensitive information; environmental, legal and litigation risks, including permitting and remediation obligations and the timing and outcome of judicial, administrative or regulatory proceedings; financing and macroeconomic risks, including the availability and cost of debt and equity capital, credit ratings and metrics, interest rates, inflation, tariffs and supply-chain or energy-market disruption arising from geopolitical events; and the other risks and uncertainties set forth in PGE’s Annual Report on Form 10-K for the year ended December 31, 2025 and Quarterly Reports on Form 10-Q filed thereafter with the U.S. Securities and Exchange Commission .

Management participants Maria Pope President and CEO Joe Trpik SVP of Finance and CFO
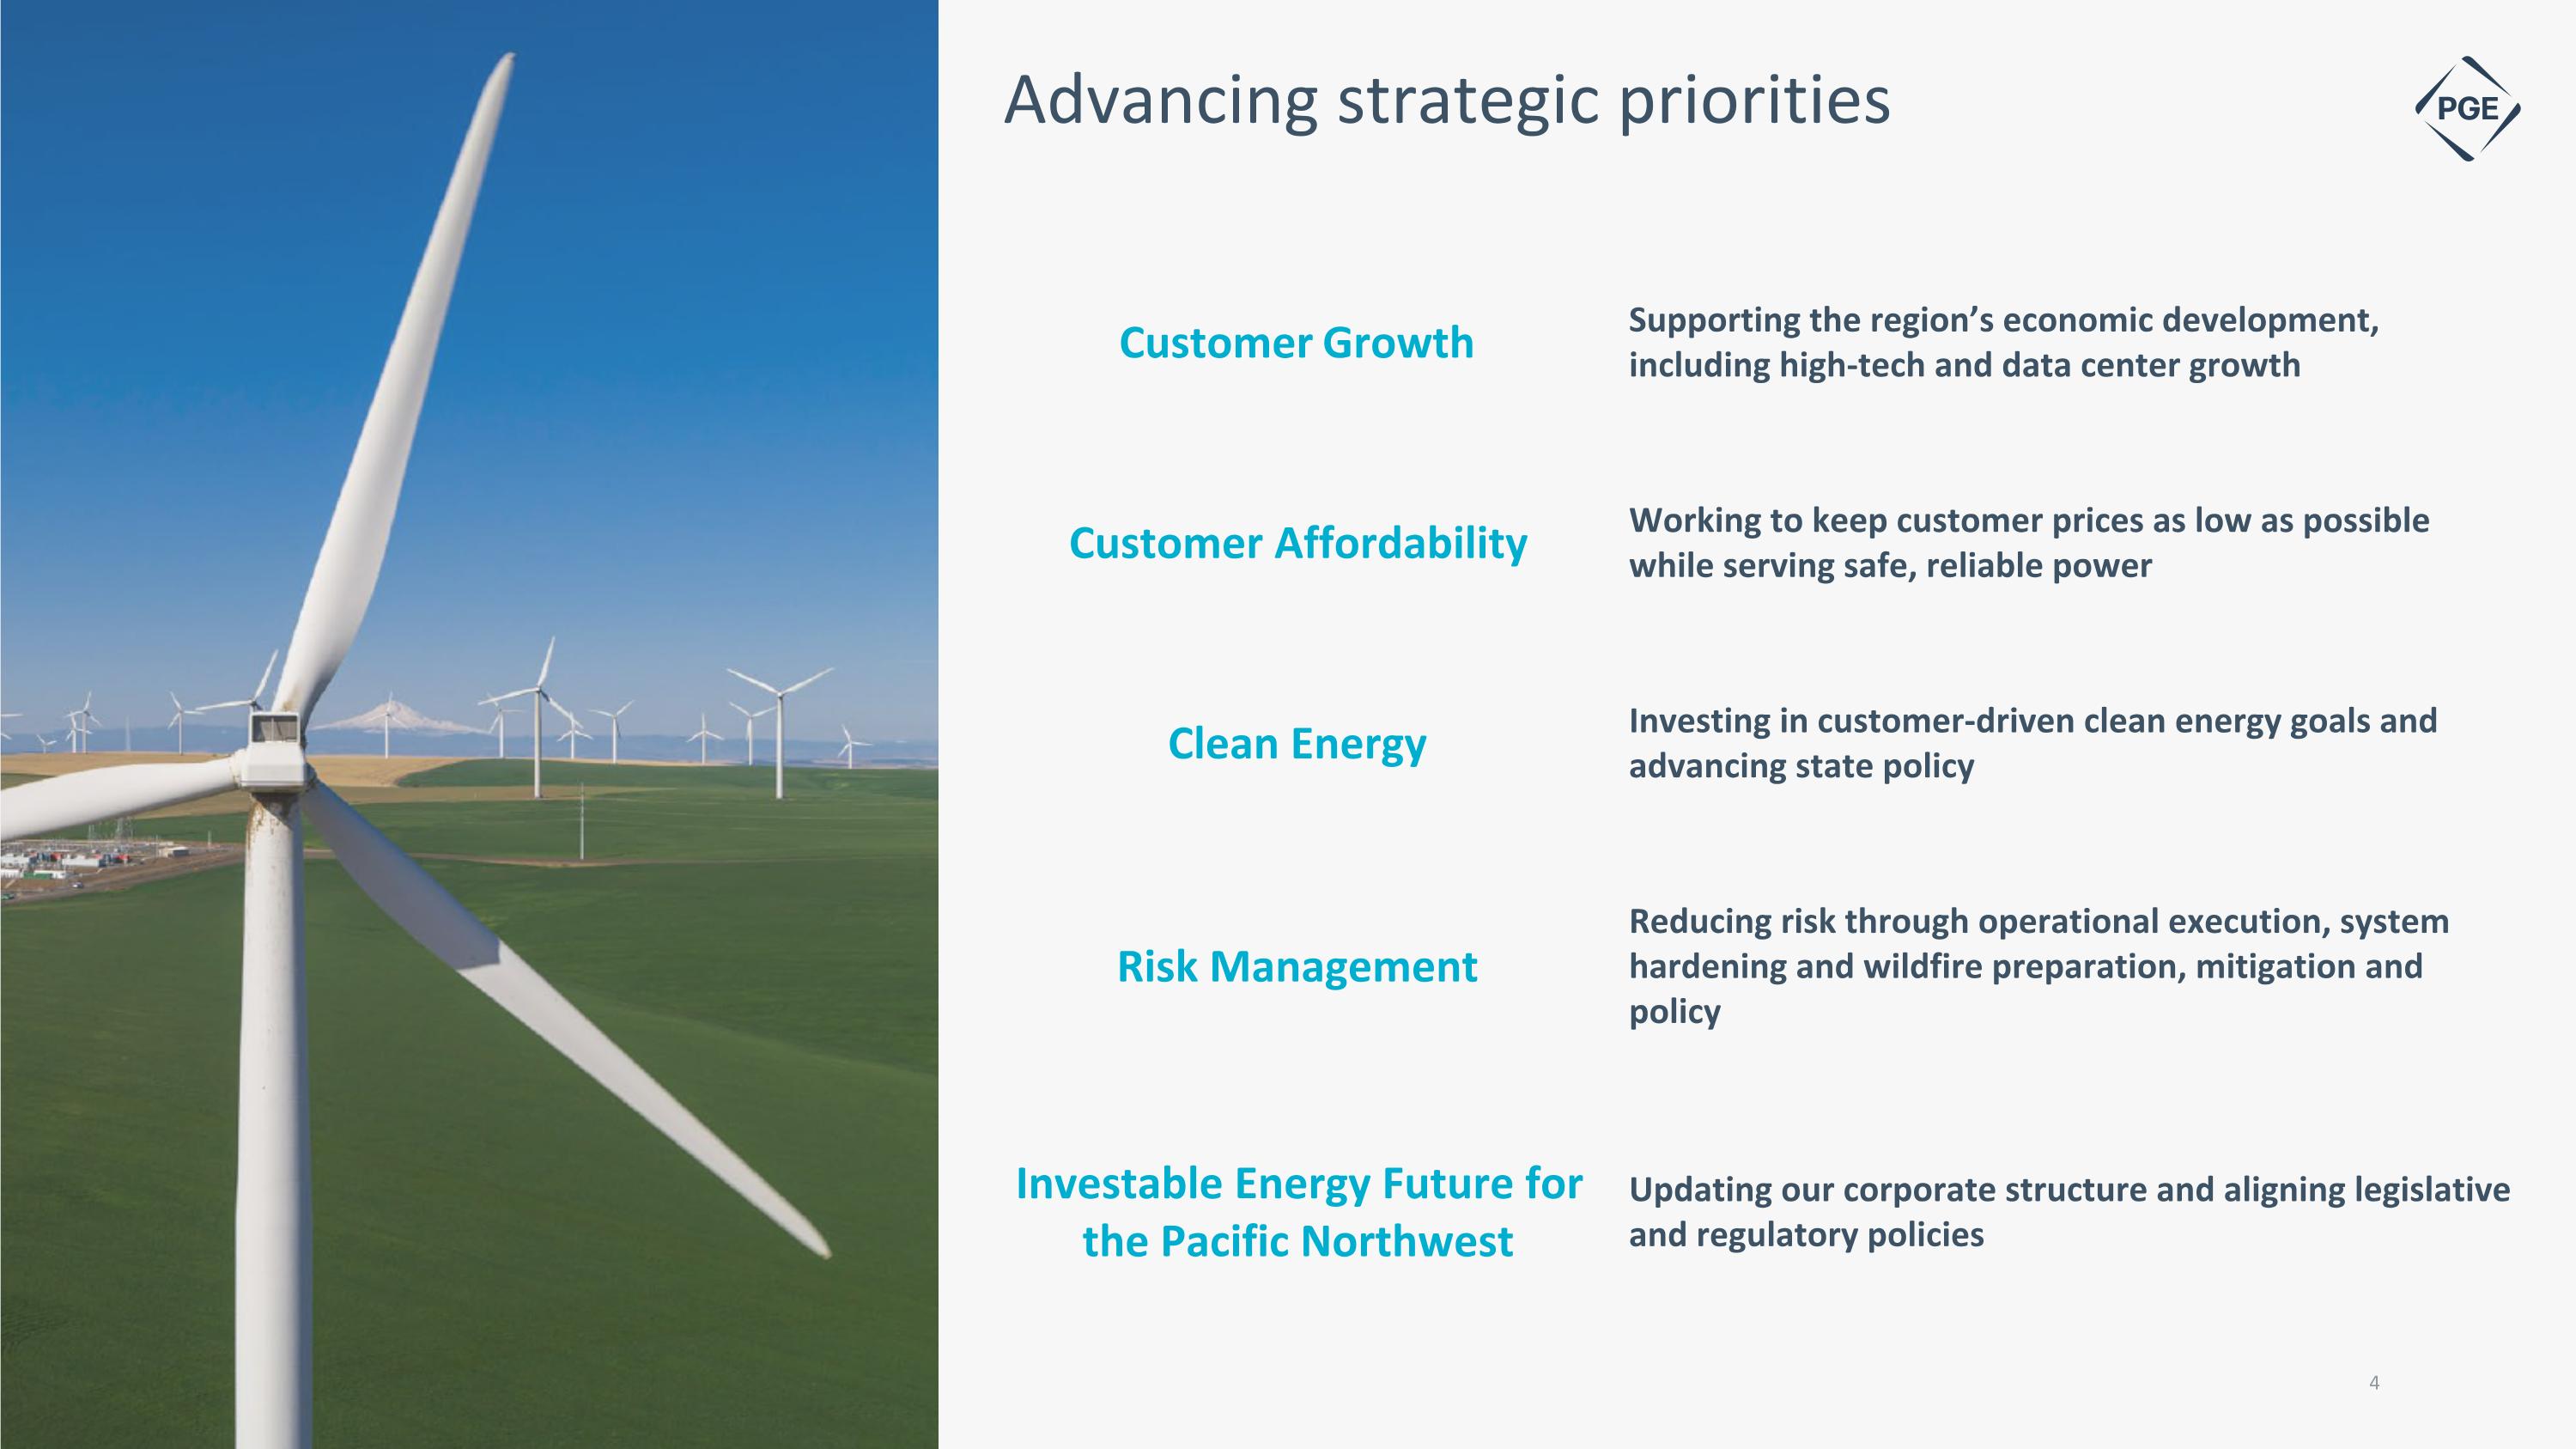
Advancing strategic priorities Customer Growth Supporting the region’s economic development, including high-tech and data center growth Customer Affordability Working to keep customer prices as low as possible while serving safe, reliable power Clean Energy Investing in customer-driven clean energy goals and advancing state policy Risk Management Reducing risk through operational execution, system hardening and wildfire preparation, mitigation and policy Investable Energy Future for the Pacific Northwest Updating our corporate structure and aligning legislative and regulatory policies
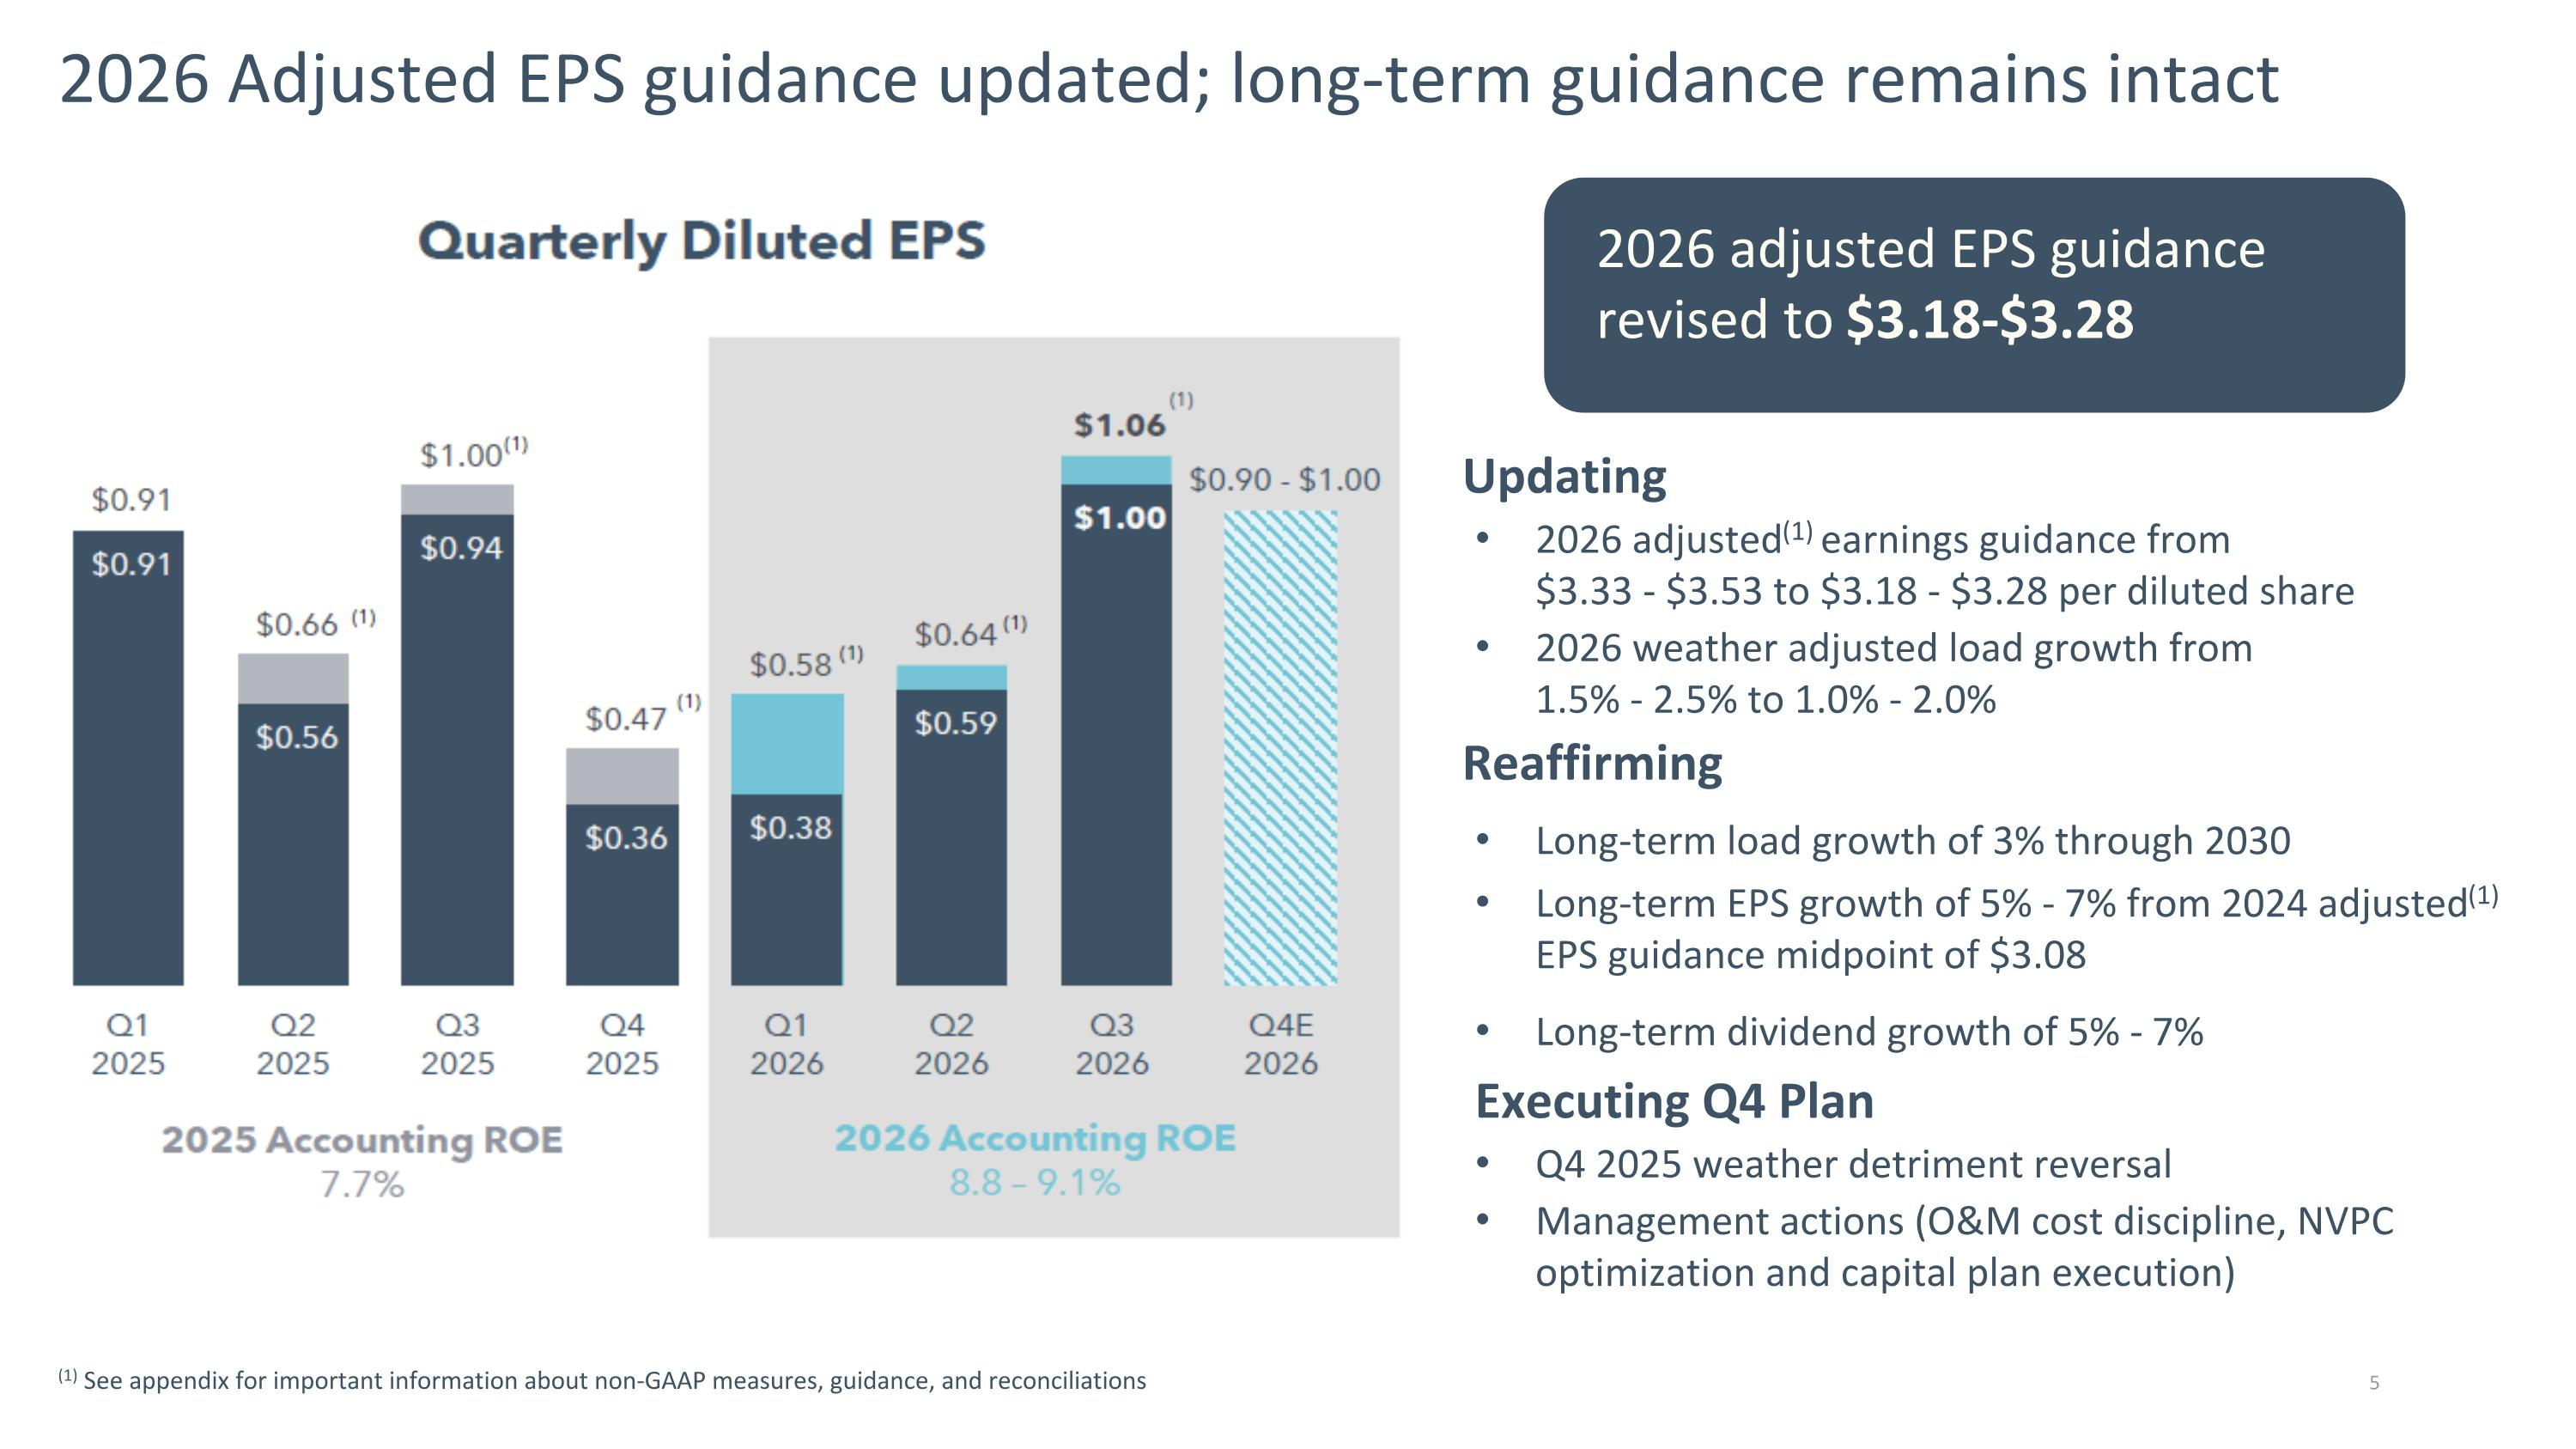
2026 Adjusted EPS guidance updated; long-term guidance remains intact (1) See appendix for important information about non-GAAP measures, guidance, and reconciliations Updating 2026 adjusted(1) earnings guidance from �$3.33 - $3.53 to $3.18 - $3.28 per diluted share 2026 weather adjusted load growth from �1.5% - 2.5% to 1.0% - 2.0% Reaffirming Long-term load growth of 3% through 2030 Long-term EPS growth of 5% - 7% from 2024 adjusted(1) EPS guidance midpoint of $3.08 Long-term dividend growth of 5% - 7% Executing Q4 Plan Q4 2025 weather detriment reversal Management actions (O&M cost discipline, NVPC optimization and capital plan execution) 2026 adjusted EPS guidance revised to $3.18-$3.28
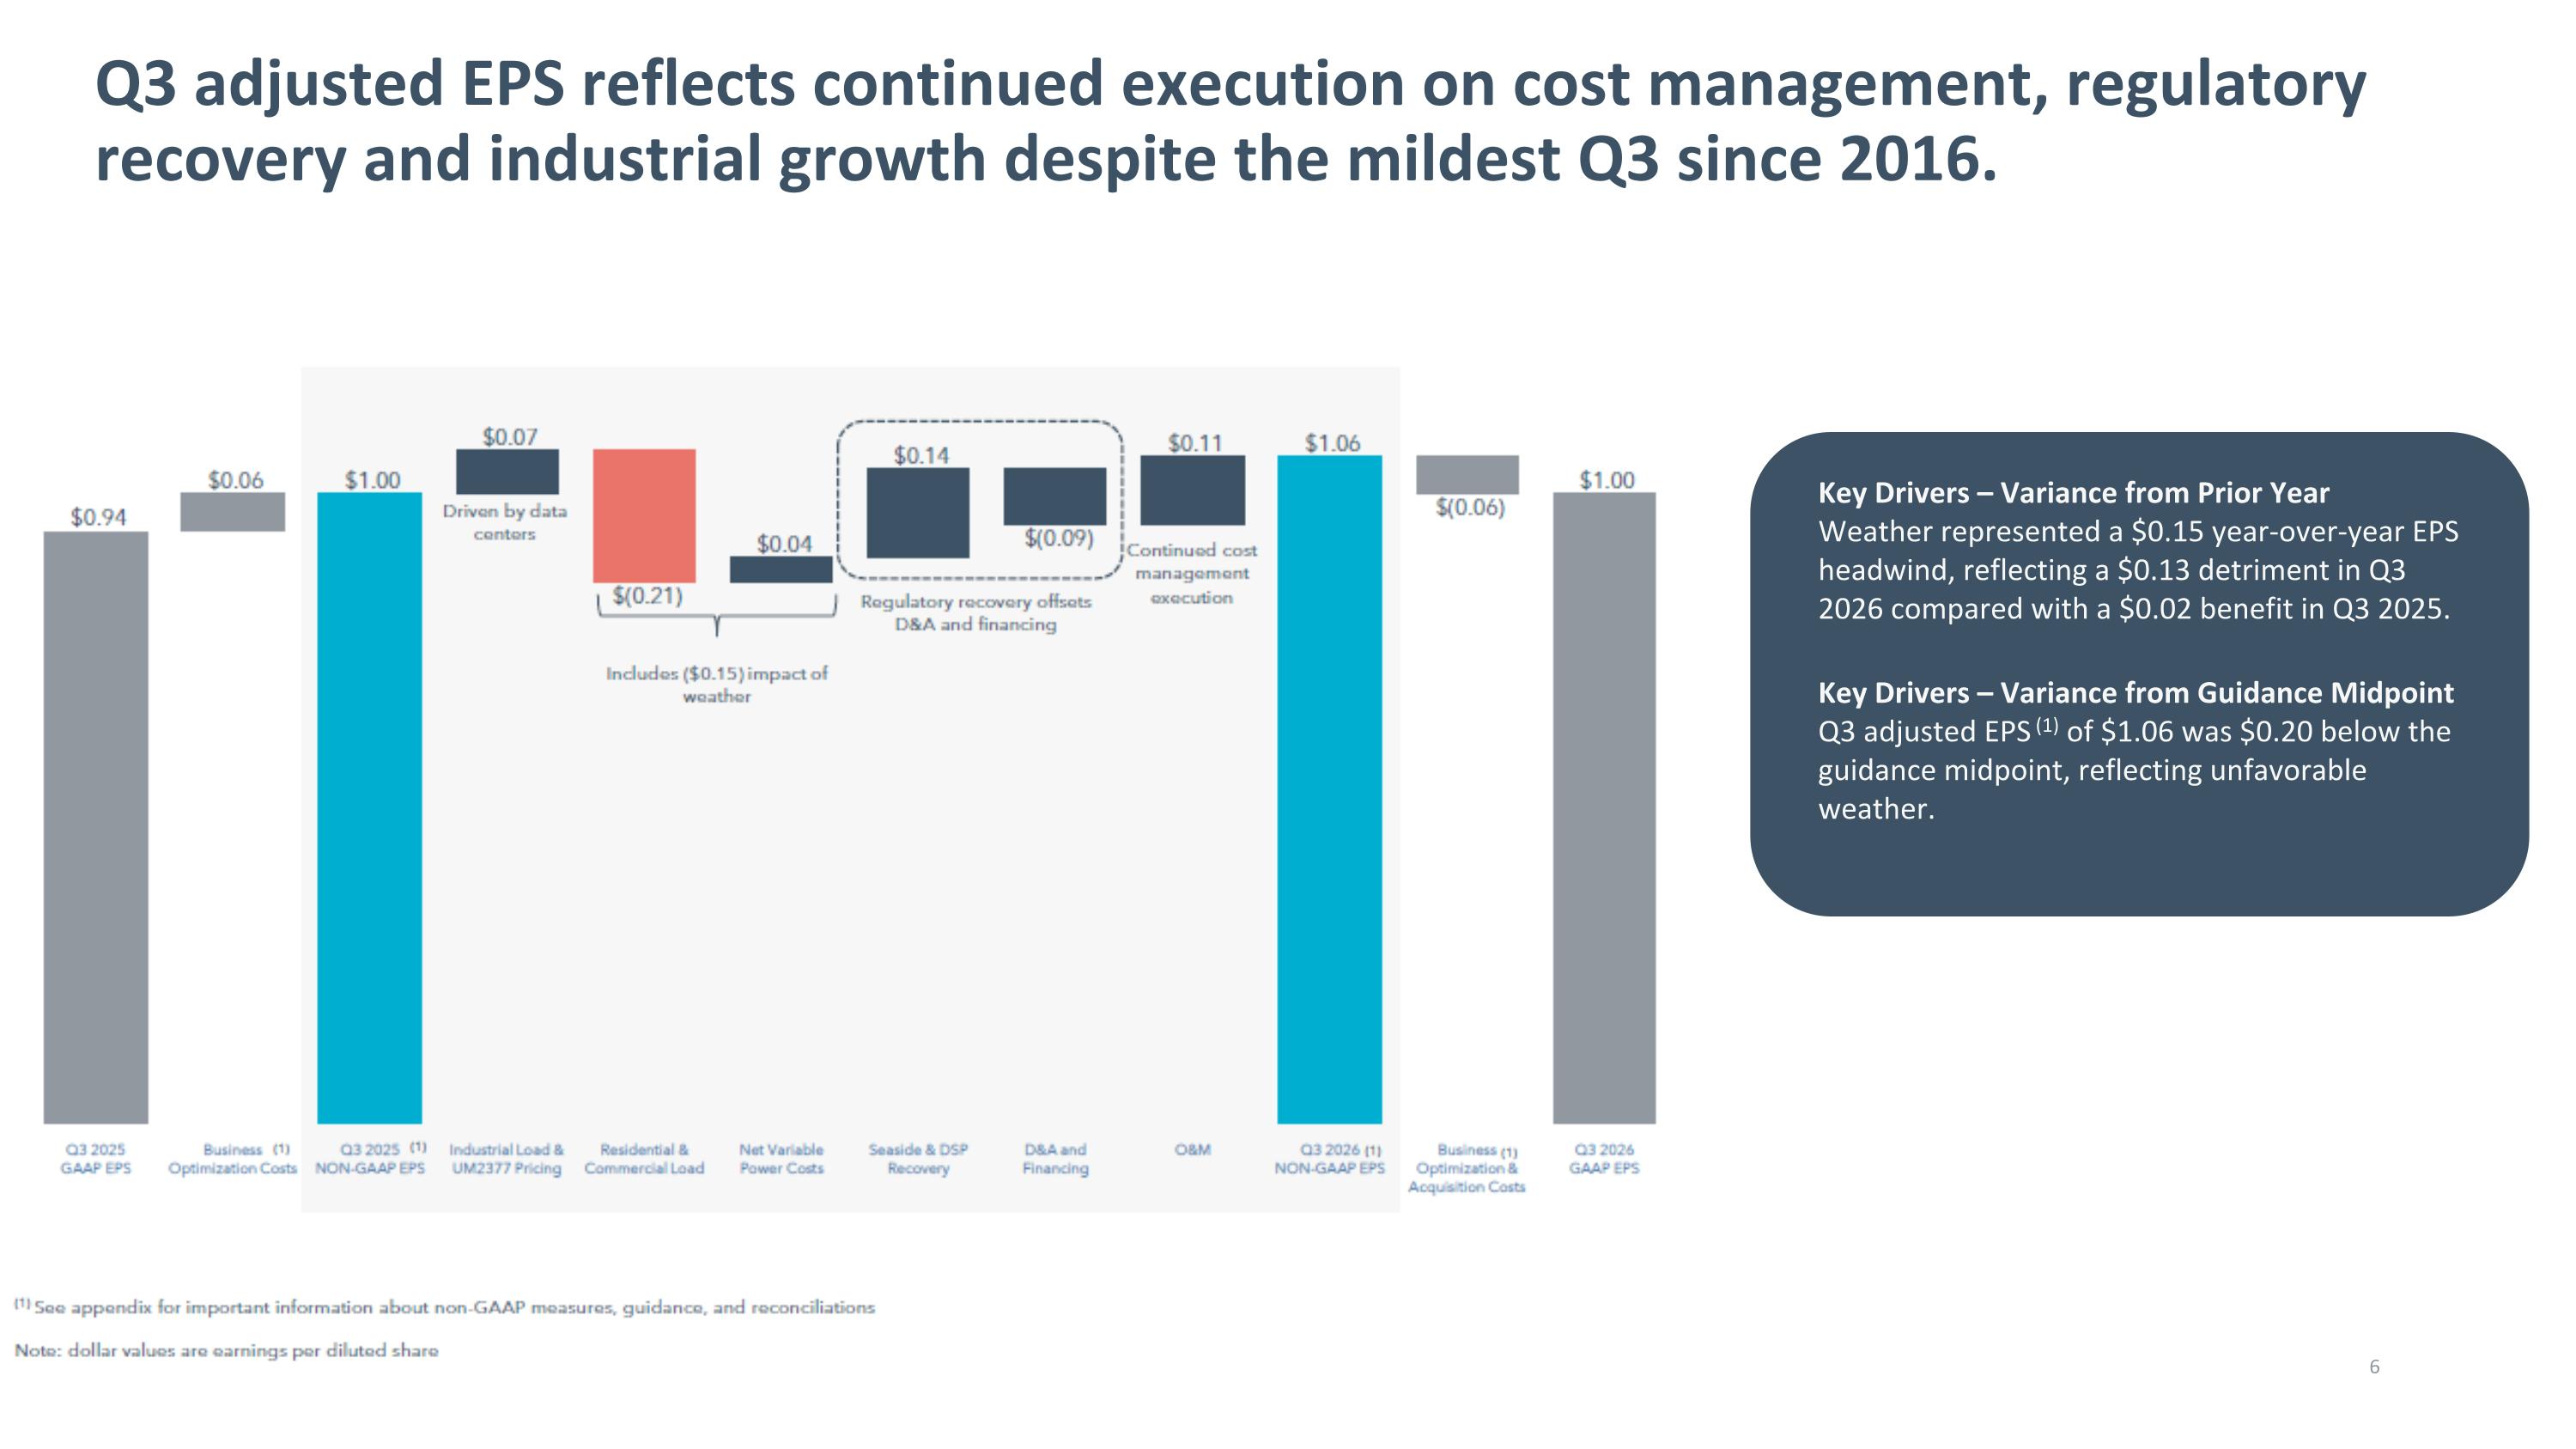
Key Drivers – Variance from Guidance Midpoint Q3 adjusted EPS (1) of $1.06 was $0.20 below the guidance midpoint, reflecting unfavorable weather. Key Drivers – Variance from Prior Year Weather represented a $0.15 year-over-year EPS headwind, reflecting a $0.13 detriment in Q3 2026 compared with a $0.02 benefit in Q3 2025. Q3 adjusted EPS reflects continued execution on cost management, regulatory recovery and industrial growth despite the mildest Q3 since 2016. 6
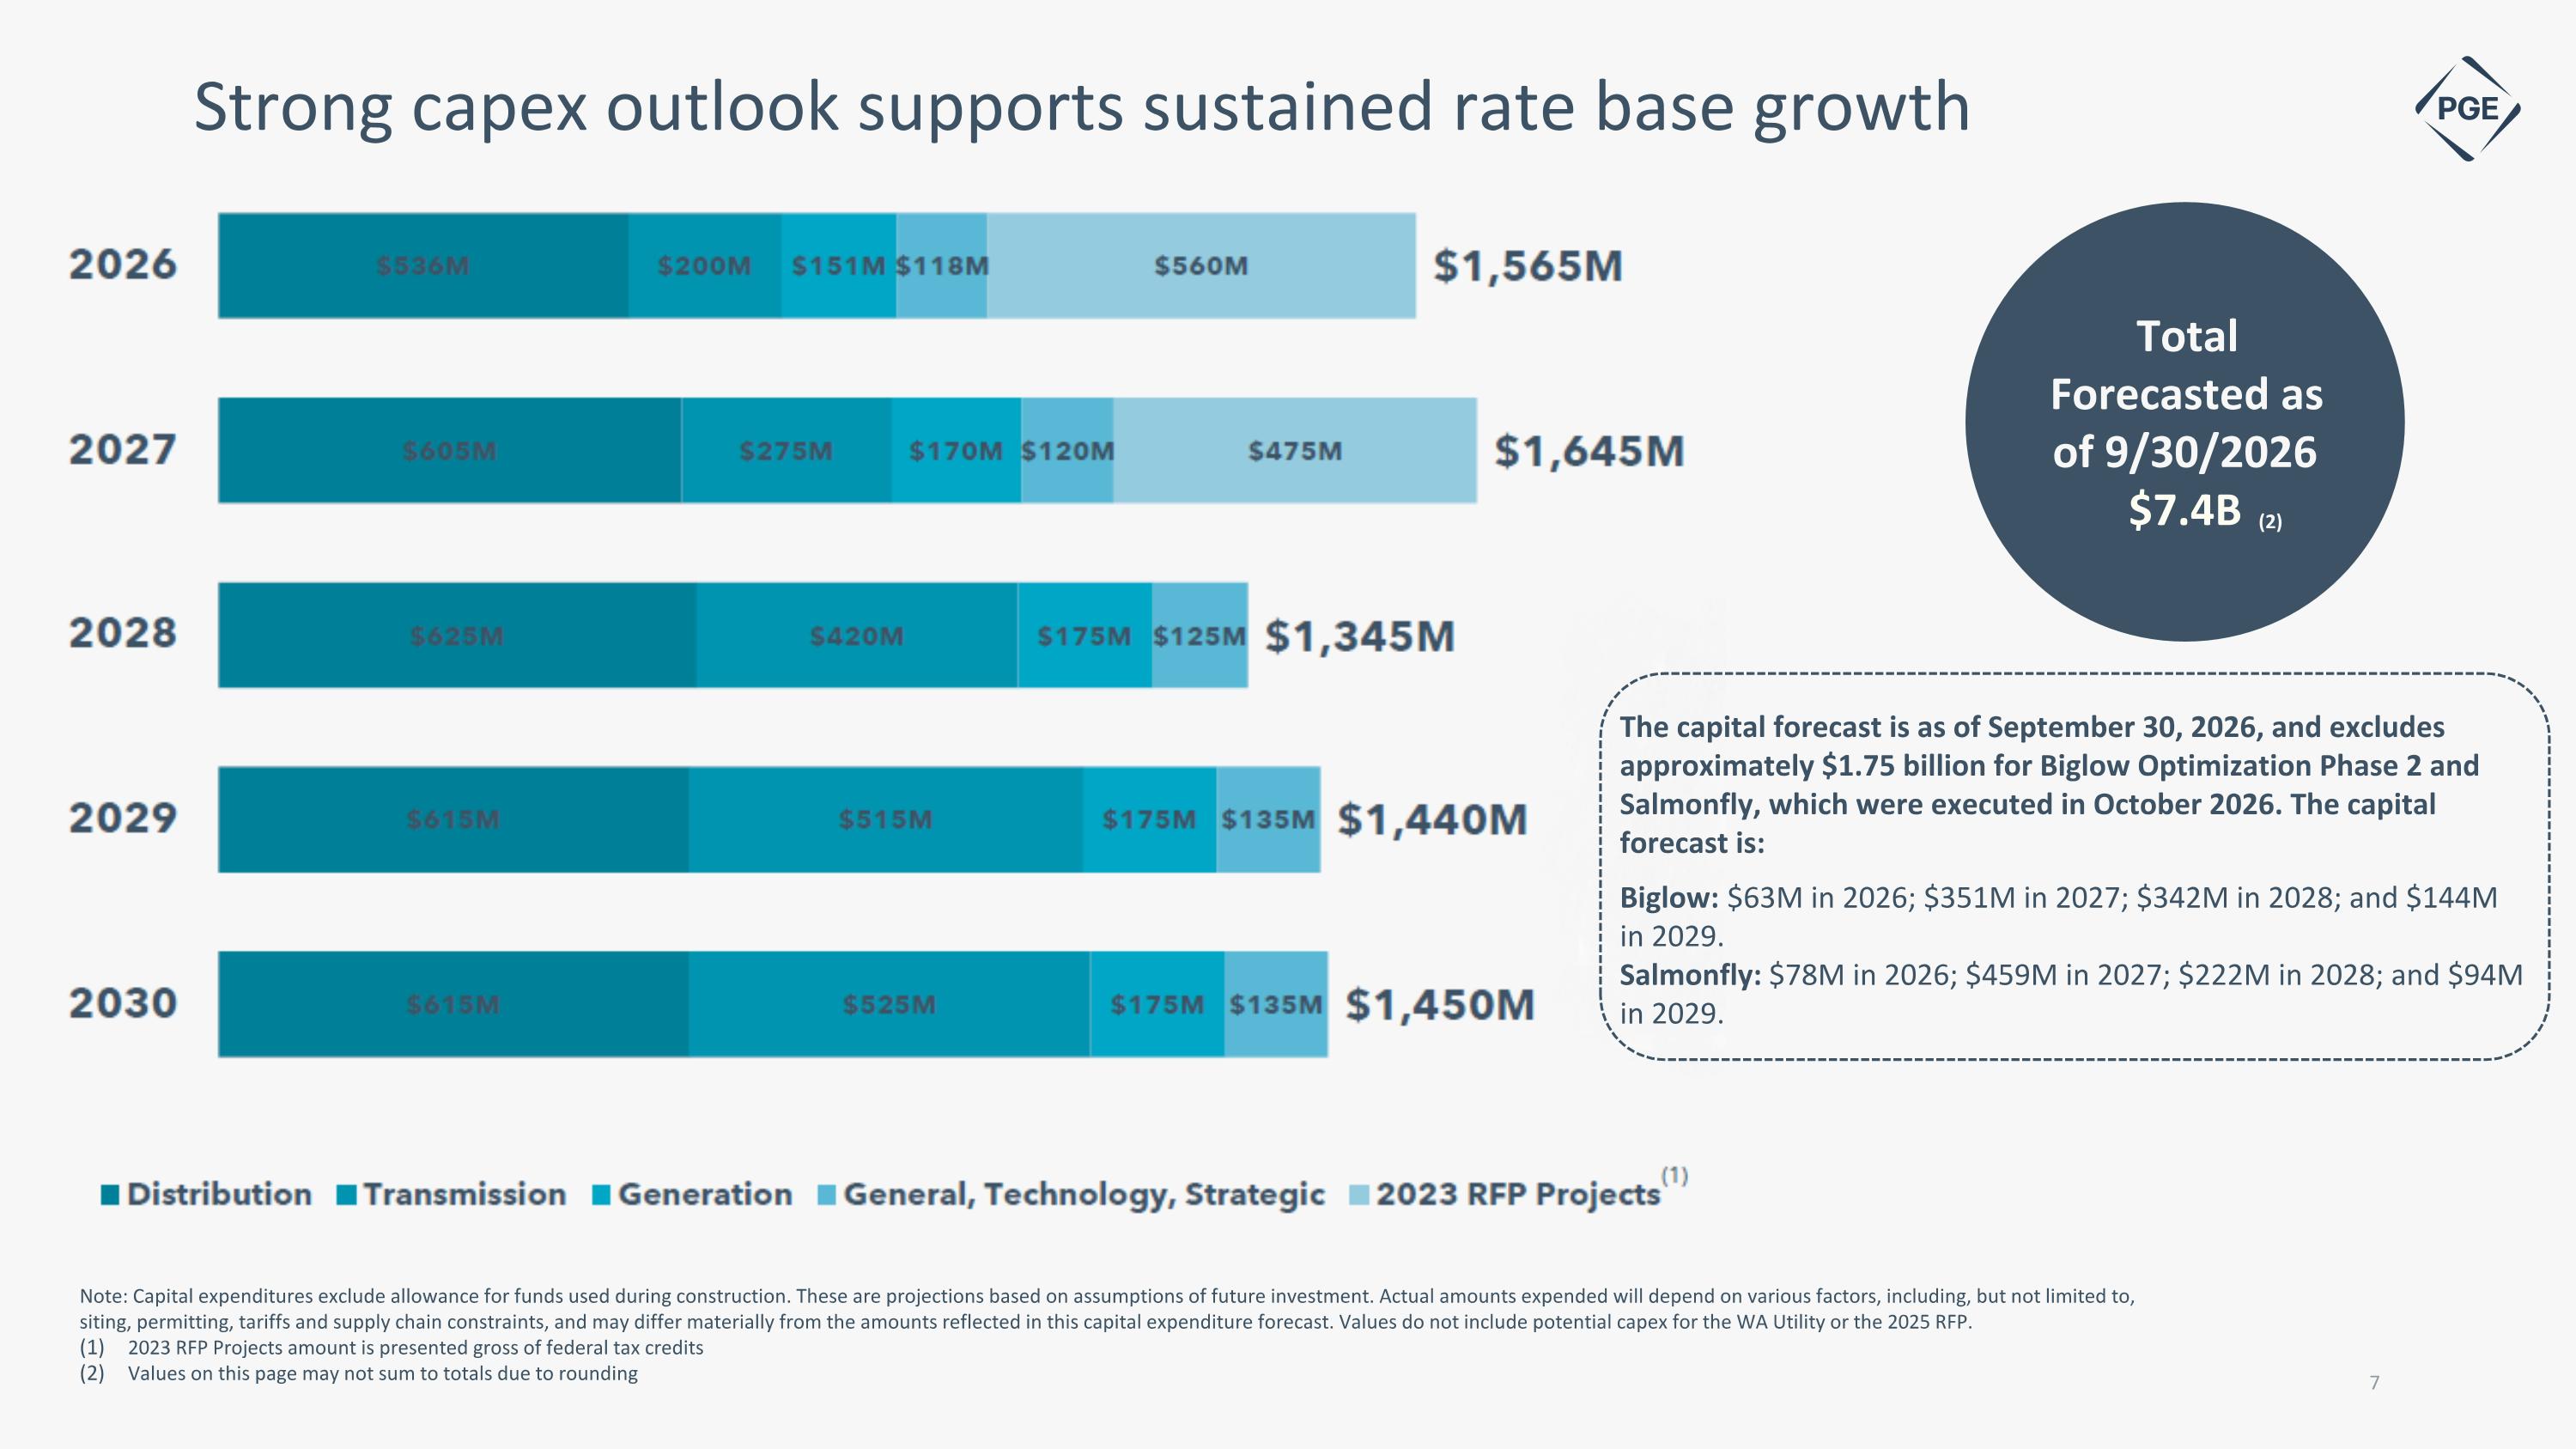
Note: Capital expenditures exclude allowance for funds used during construction. These are projections based on assumptions of future investment. Actual amounts expended will depend on various factors, including, but not limited to, siting, permitting, tariffs and supply chain constraints, and may differ materially from the amounts reflected in this capital expenditure forecast. Values do not include potential capex for the WA Utility or the 2025 RFP. 2023 RFP Projects amount is presented gross of federal tax credits Values on this page may not sum to totals due to rounding Strong capex outlook supports sustained rate base growth Total Forecasted as of 9/30/2026 $7.4B (2) The capital forecast is as of September 30, 2026, and excludes approximately $1.75 billion for Biglow Optimization Phase 2 and Salmonfly, which were executed in October 2026. The capital forecast is: Biglow: $63M in 2026; $351M in 2027; $342M in 2028; and $144M in 2029.�Salmonfly: $78M in 2026; $459M in 2027; $222M in 2028; and $94M in 2029.
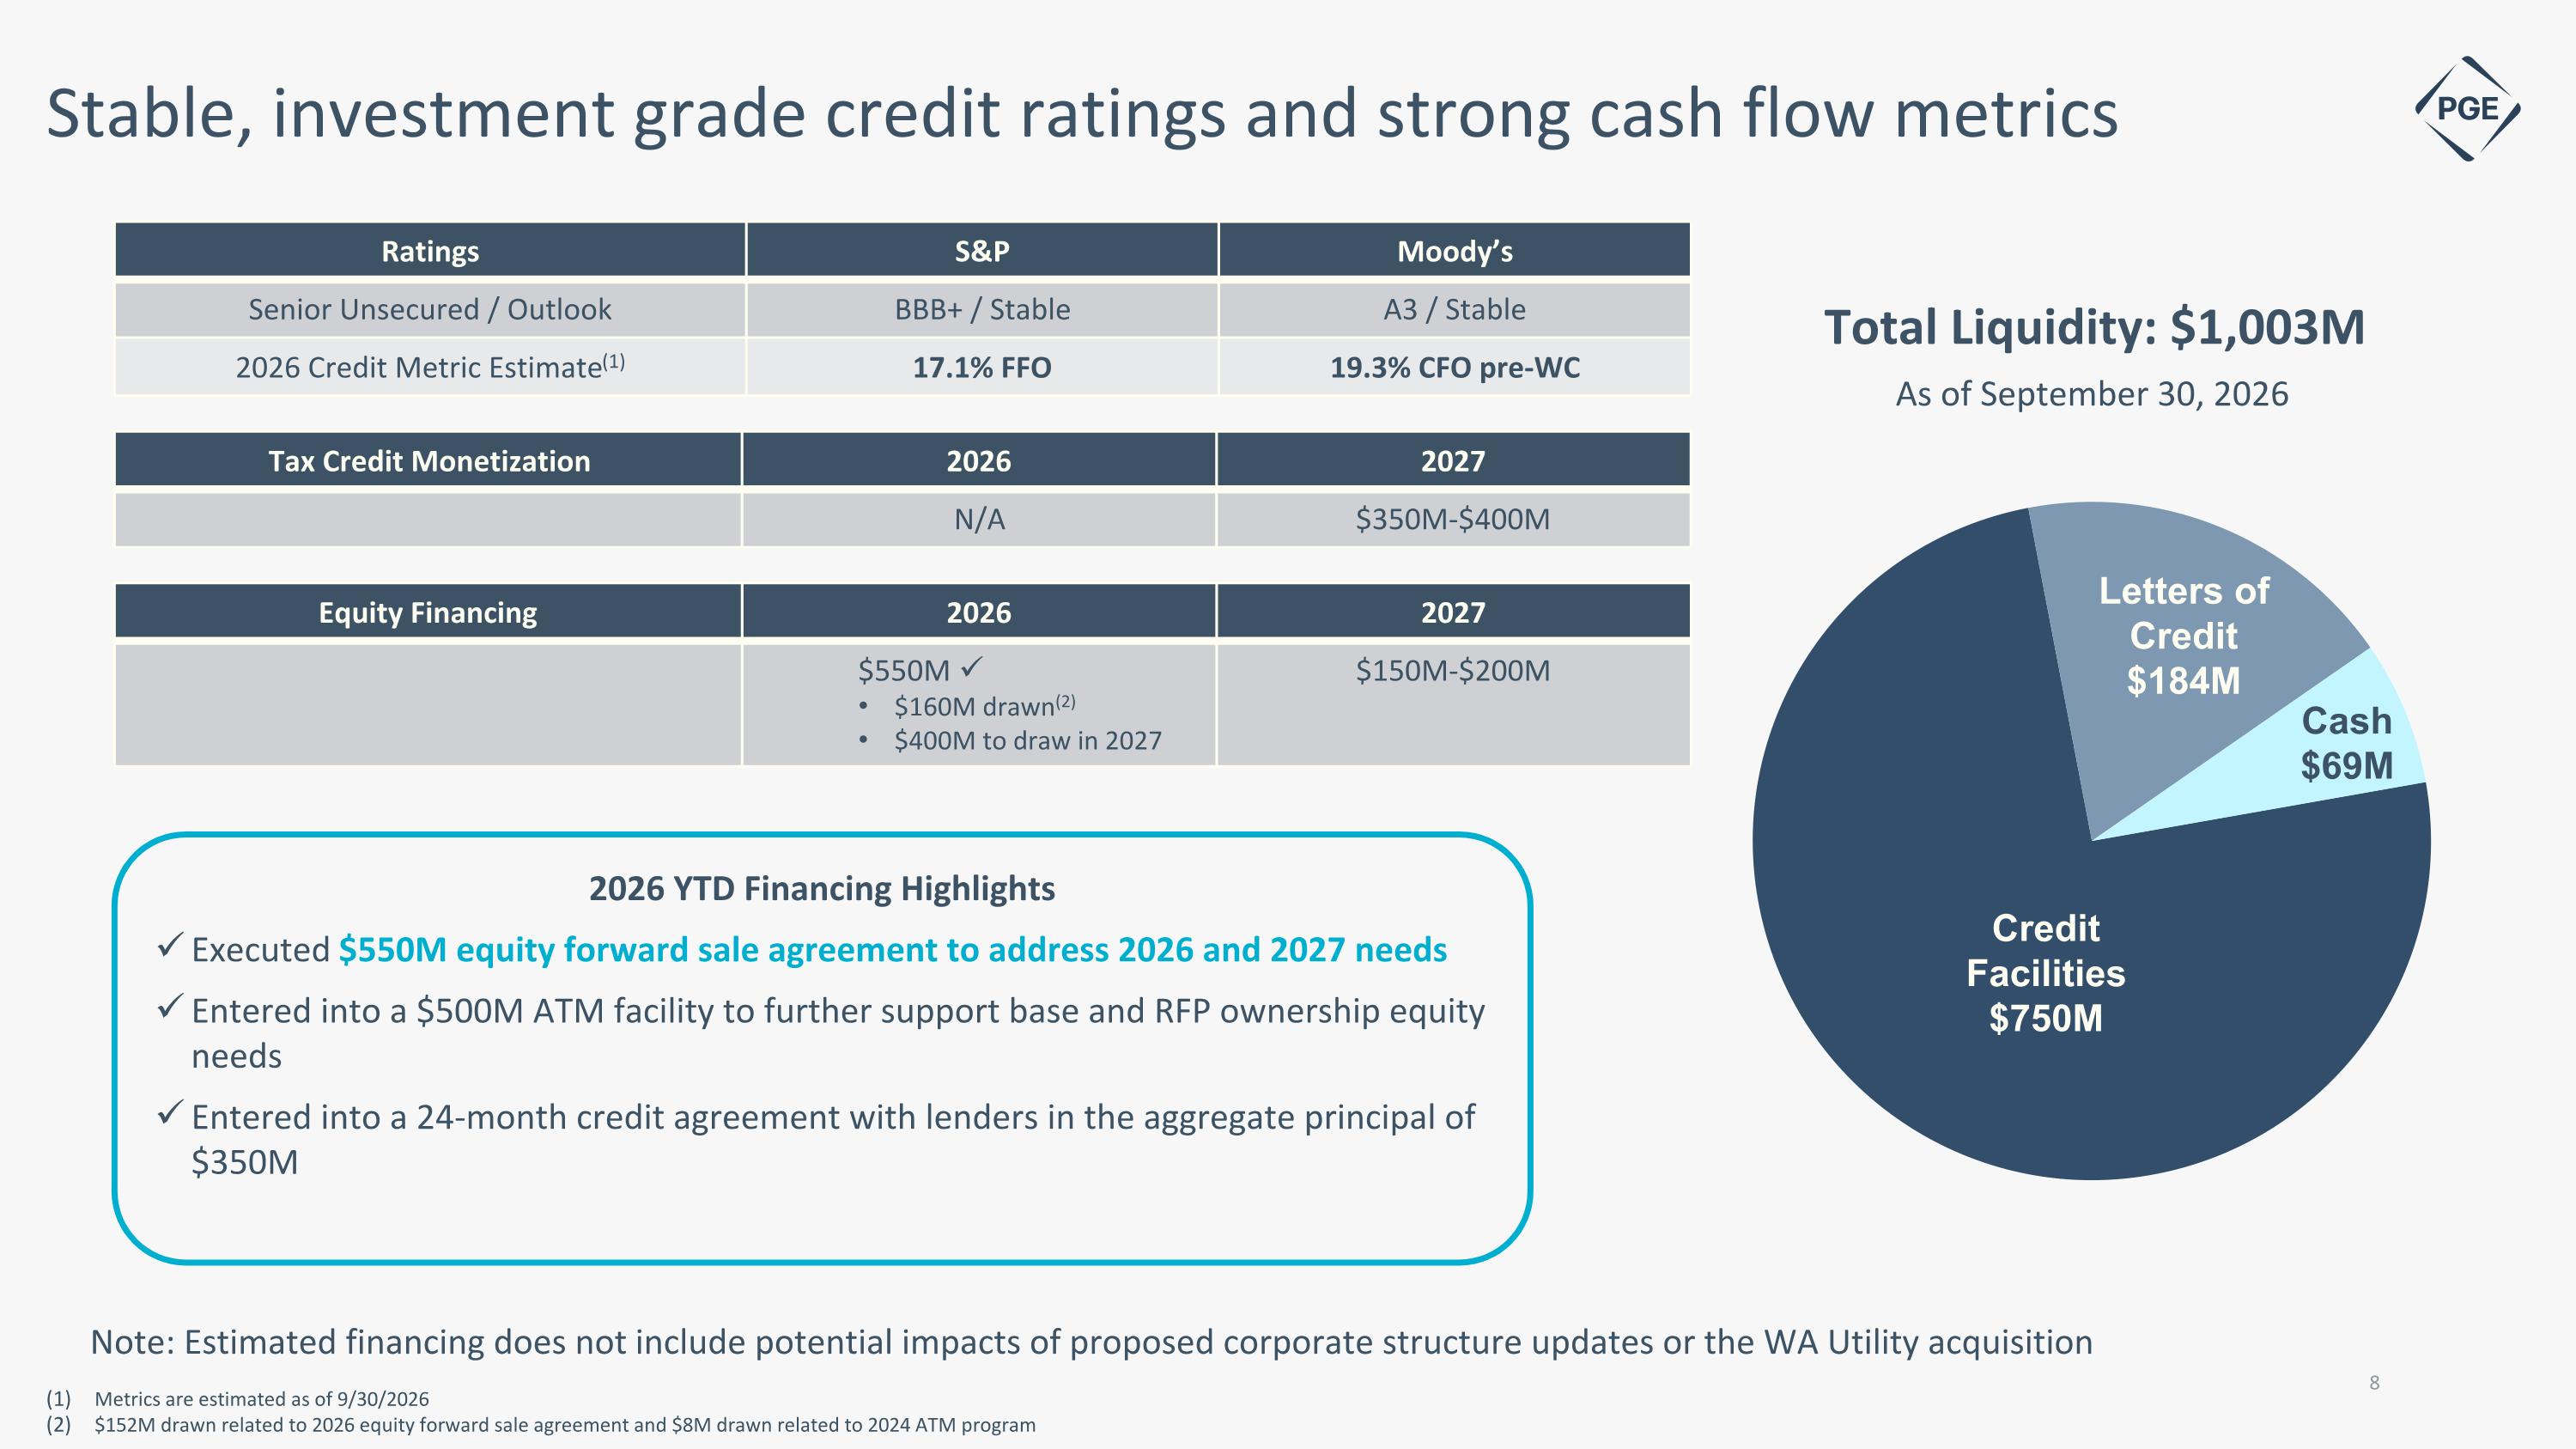
Ratings S&P Moody’s Senior Unsecured / Outlook BBB+ / Stable A3 / Stable 2026 Credit Metric Estimate(1) 17.1% FFO 19.3% CFO pre-WC Stable, investment grade credit ratings and strong cash flow metrics Metrics are estimated as of 9/30/2026 $152M drawn related to 2026 equity forward sale agreement and $8M drawn related to 2024 ATM program Equity Financing 2026 2027 $550M $160M drawn(2) $400M to draw in 2027 $150M-$200M 2026 YTD Financing Highlights Executed $550M equity forward sale agreement to address 2026 and 2027 needs Entered into a $500M ATM facility to further support base and RFP ownership equity needs Entered into a 24-month credit agreement with lenders in the aggregate principal of $350M Note: Estimated financing does not include potential impacts of proposed corporate structure updates or the WA Utility acquisition Tax Credit Monetization 2026 2027 N/A $350M-$400M

Appendix 9
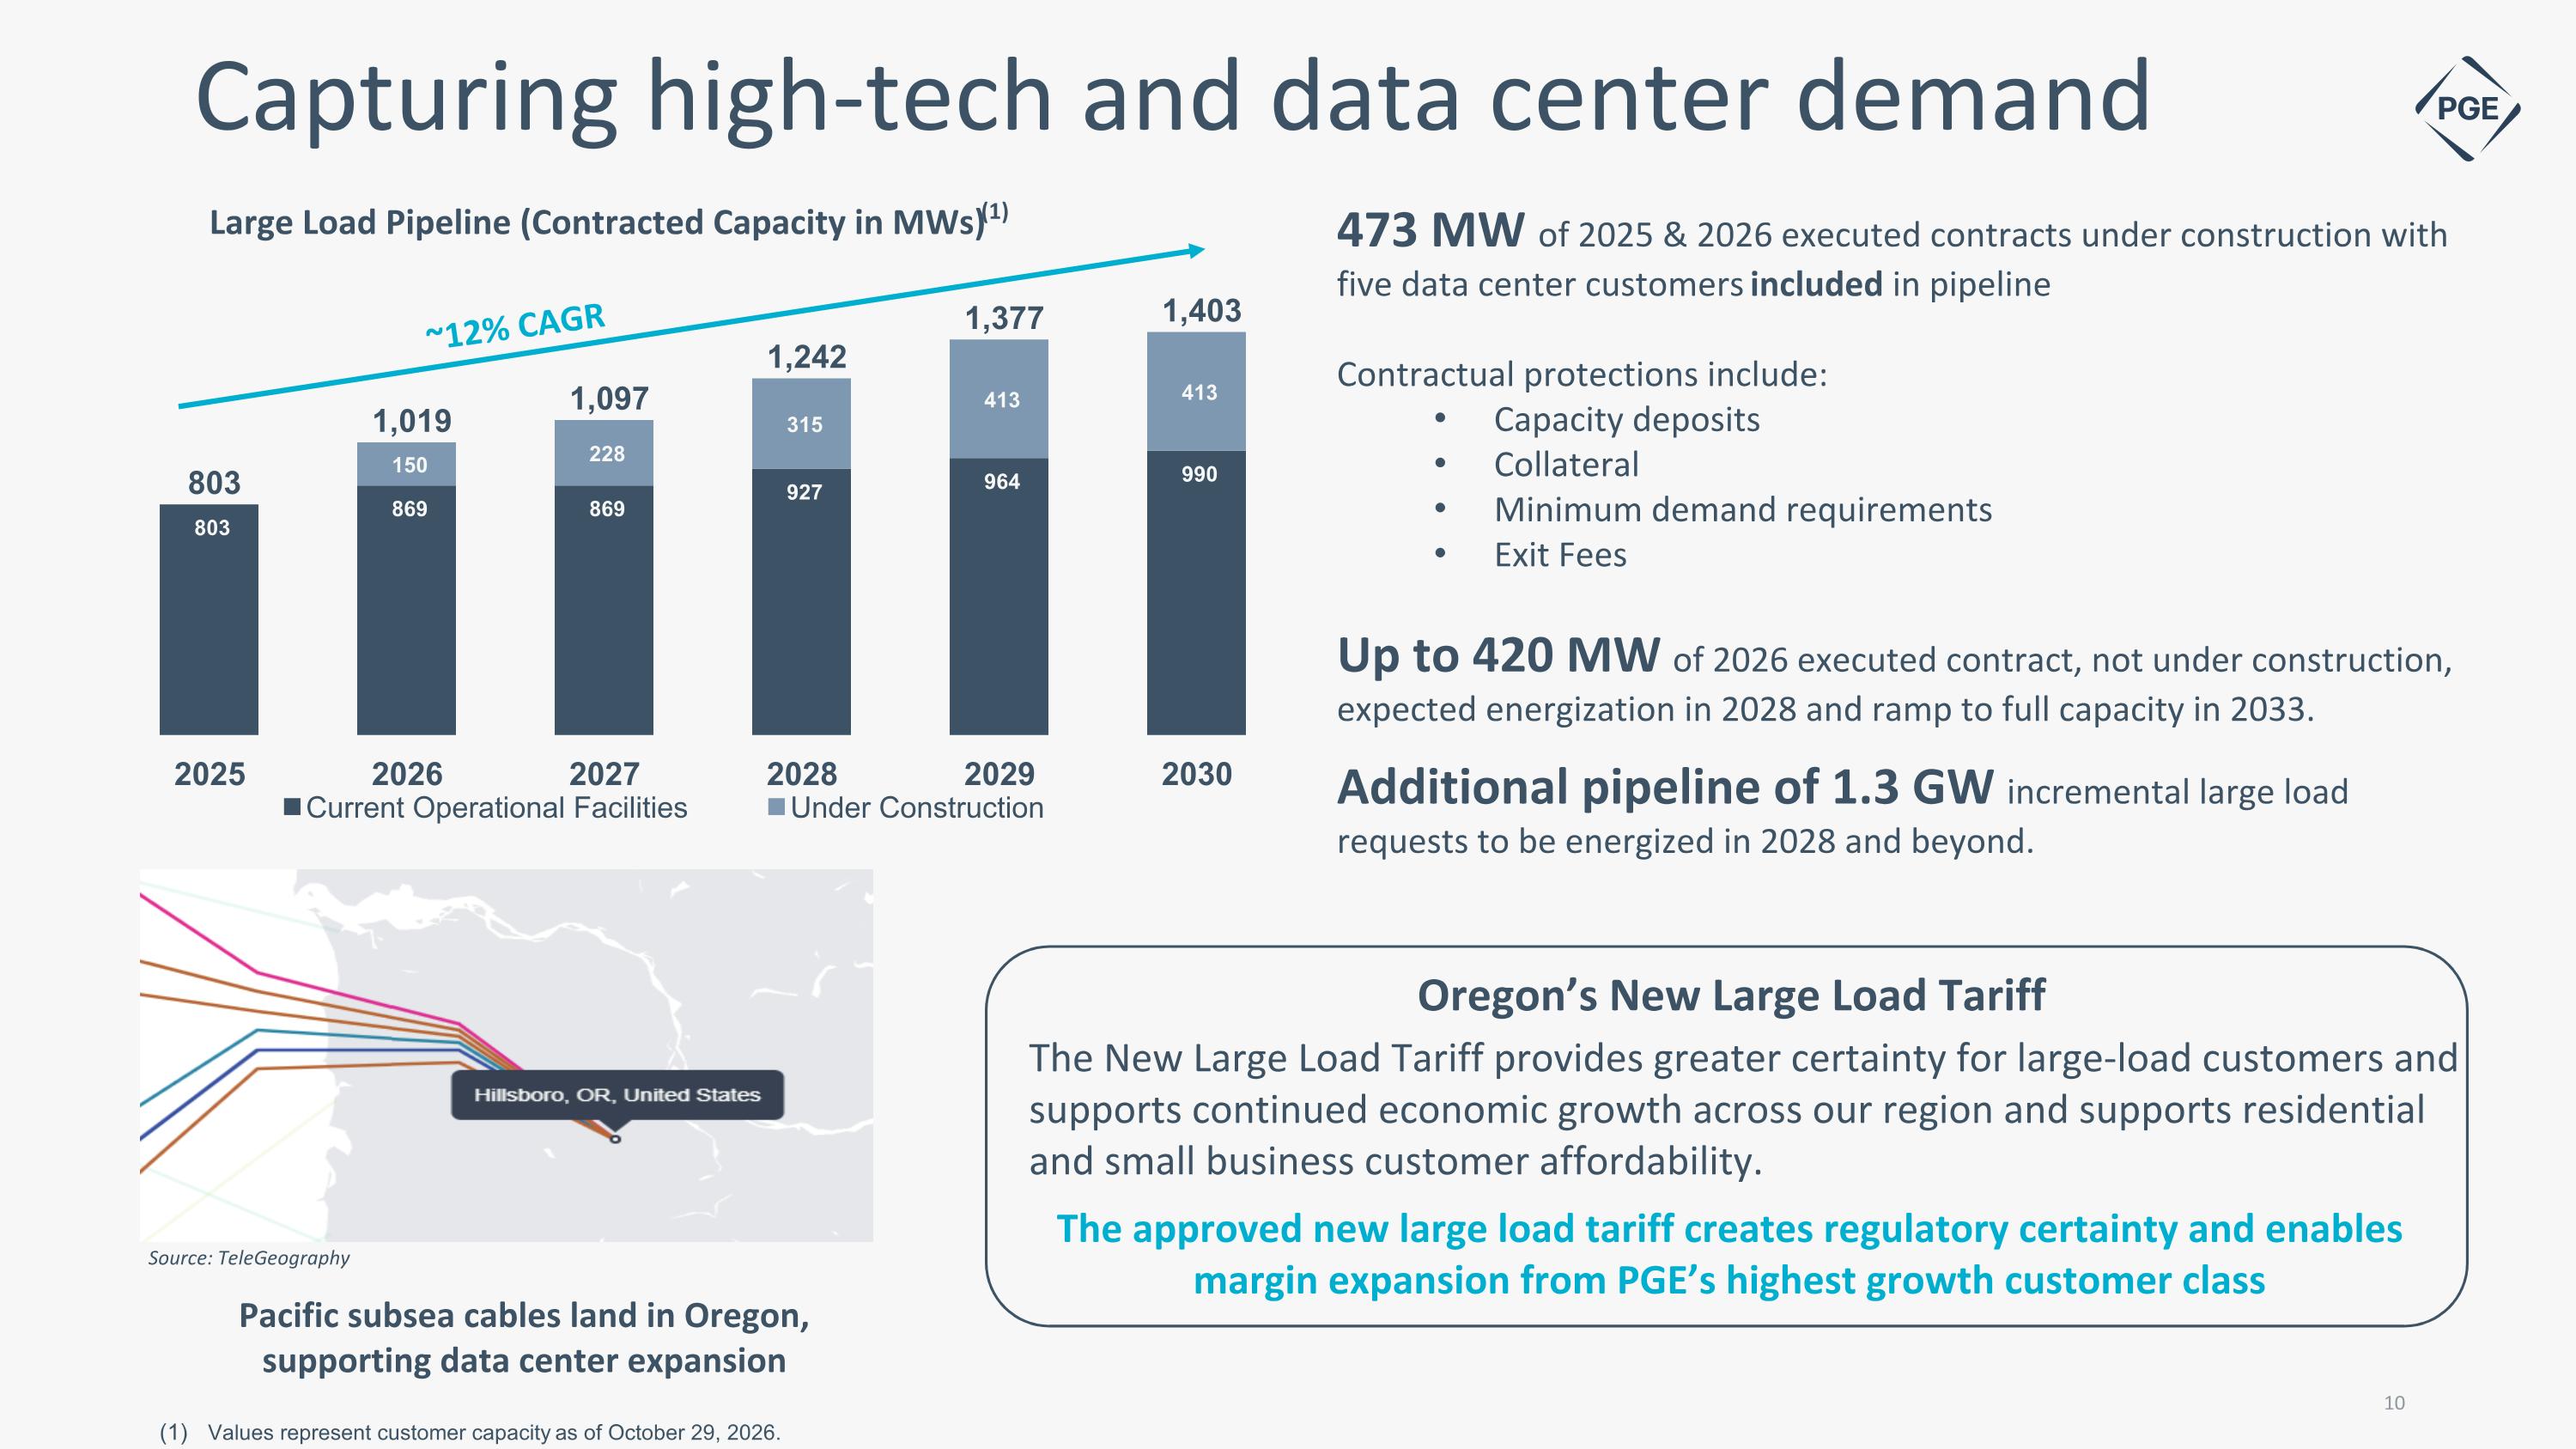
Capturing high-tech and data center demand Values represent customer capacity as of October 29, 2026. Oregon’s New Large Load Tariff The New Large Load Tariff provides greater certainty for large-load customers and supports continued economic growth across our region and supports residential and small business customer affordability. The approved new large load tariff creates regulatory certainty and enables margin expansion from PGE’s highest growth customer class ~12% CAGR 473 MW of 2025 & 2026 executed contracts under construction with five data center customers included in pipeline Contractual protections include: Capacity deposits Collateral Minimum demand requirements Exit Fees Up to 420 MW of 2026 executed contract, not under construction, expected energization in 2028 and ramp to full capacity in 2033. Additional pipeline of 1.3 GW incremental large load requests to be energized in 2028 and beyond. Pacific subsea cables land in Oregon, supporting data center expansion Source: TeleGeography
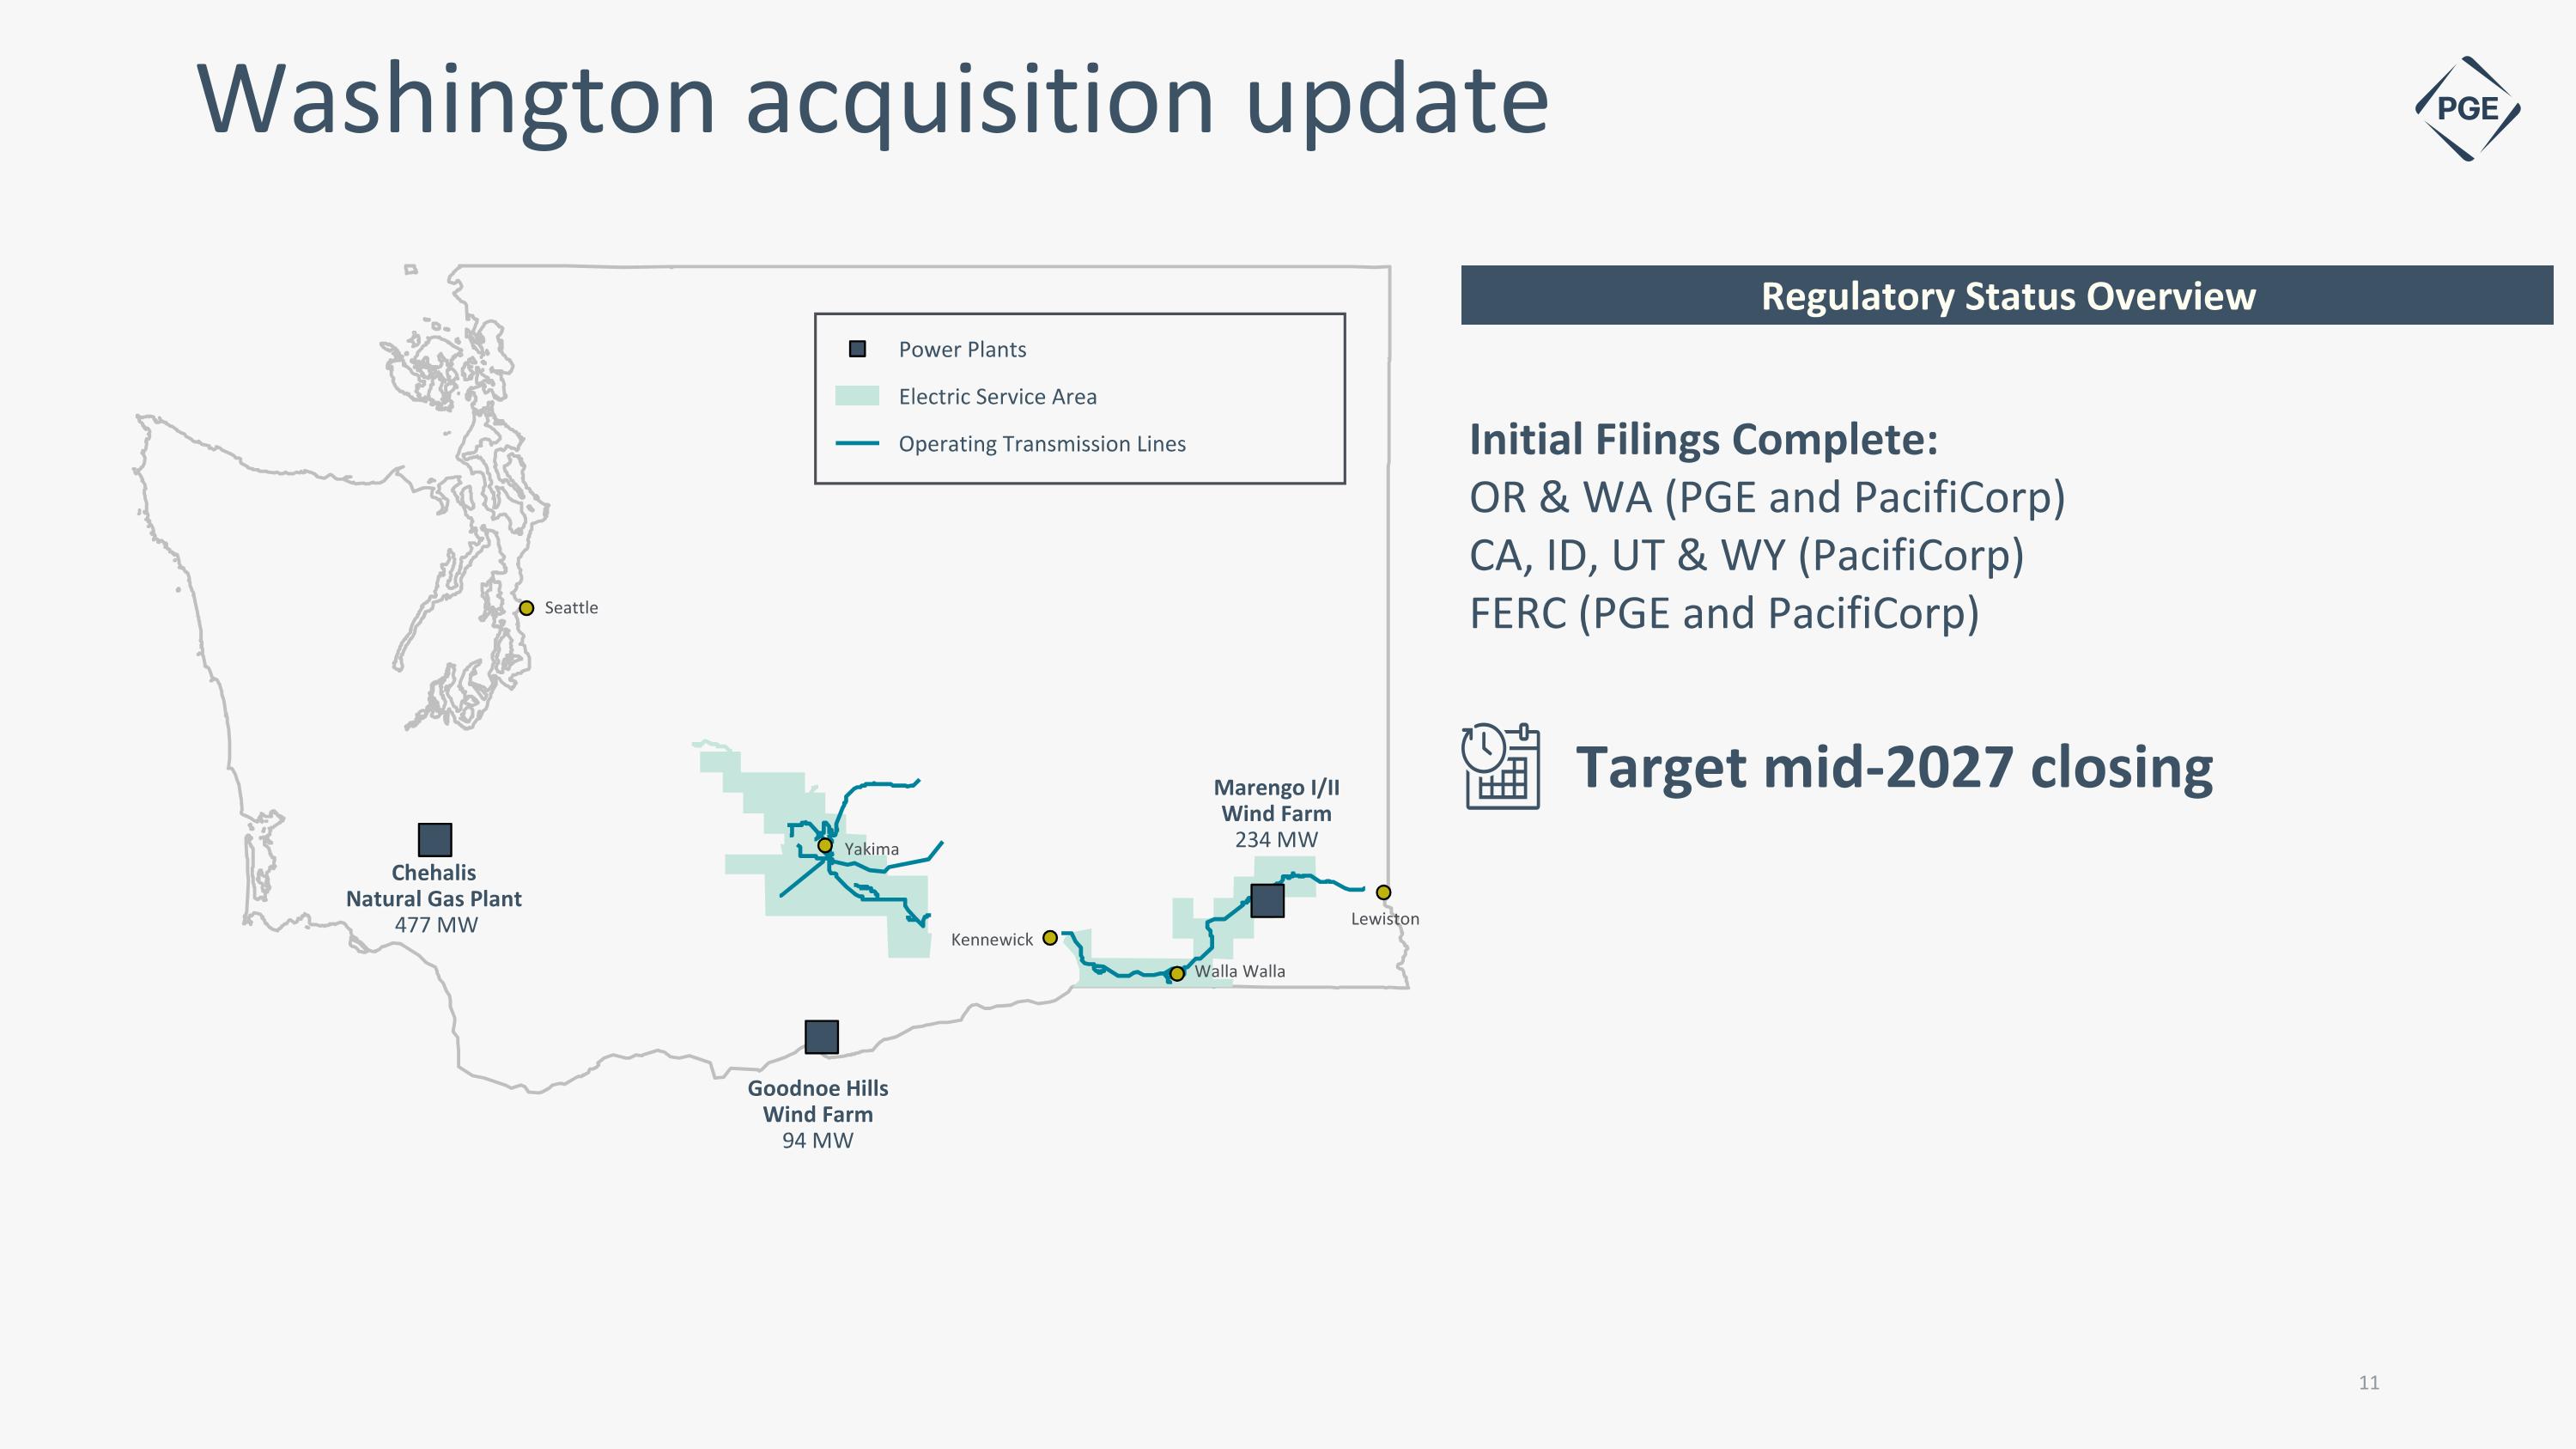
Washington acquisition update Regulatory Status Overview 11 Electric Service Area Operating Transmission Lines Power Plants Chehalis Natural Gas Plant 477 MW Seattle Goodnoe Hills�Wind Farm 94 MW Marengo I/II�Wind Farm 234 MW Lewiston Walla Walla Kennewick Yakima Initial Filings Complete: OR & WA (PGE and PacifiCorp) CA, ID, UT & WY (PacifiCorp) FERC (PGE and PacifiCorp) Target mid-2027 closing
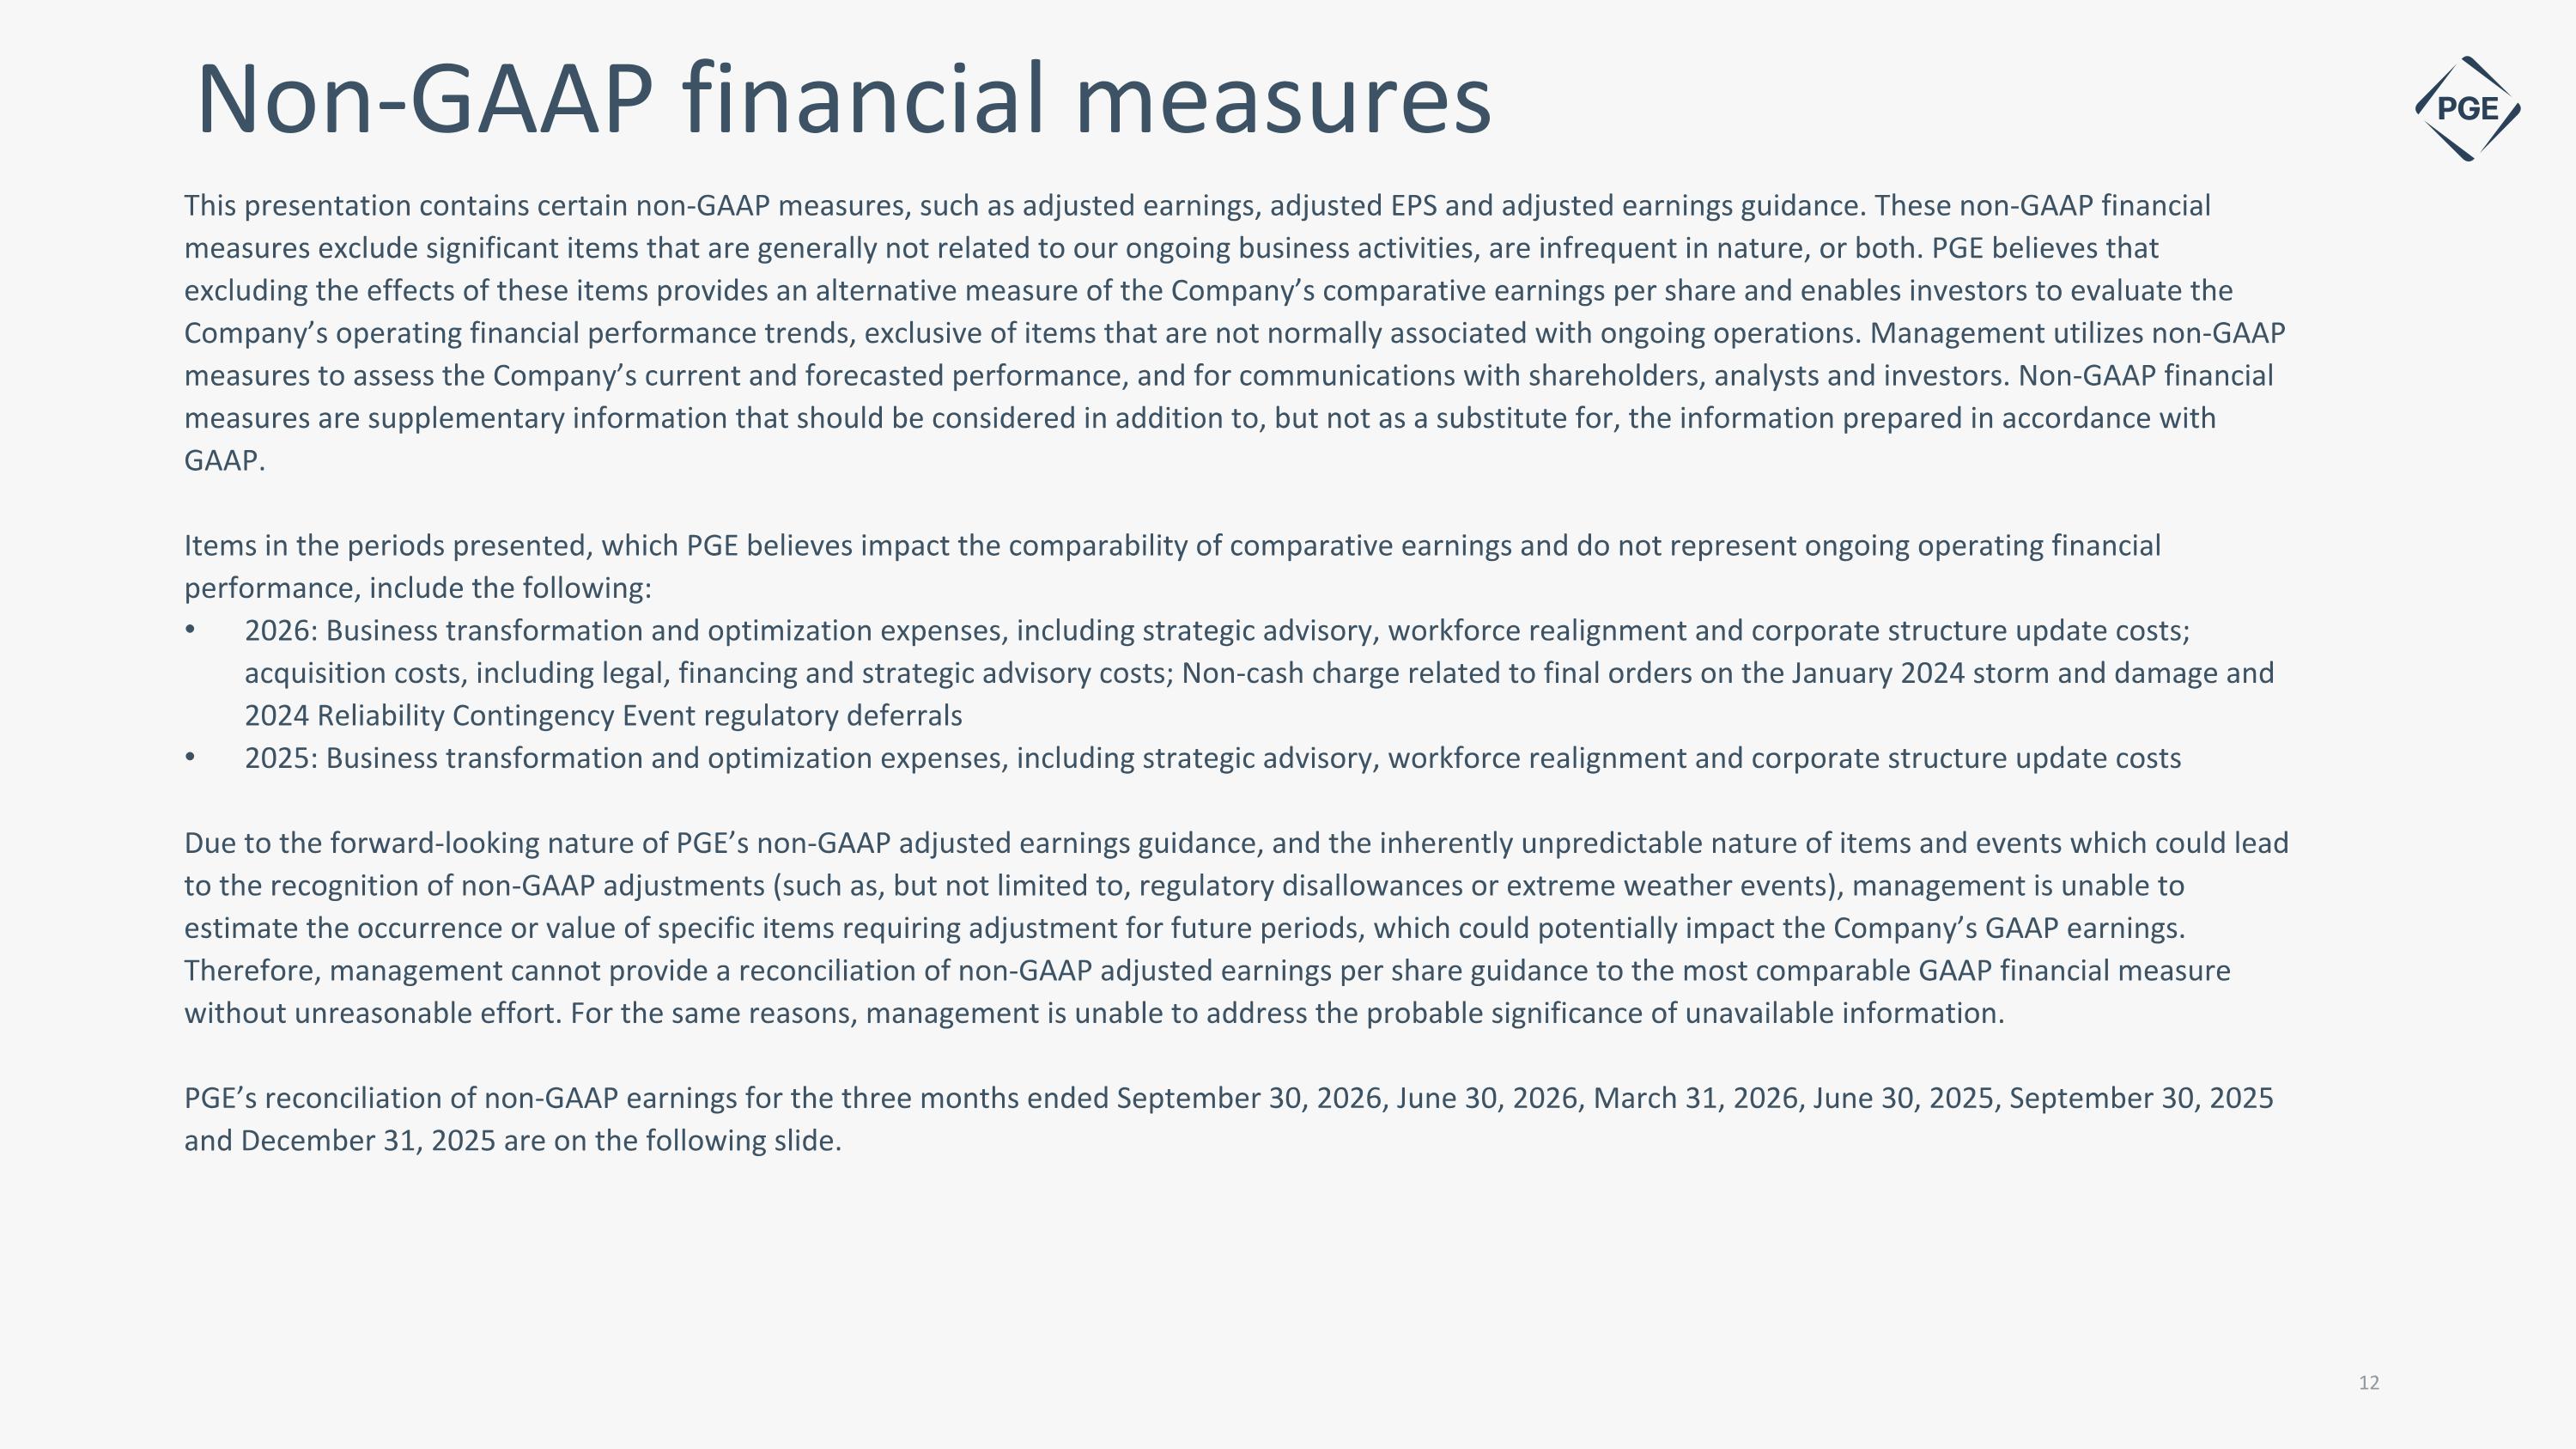
This presentation contains certain non-GAAP measures, such as adjusted earnings, adjusted EPS and adjusted earnings guidance. These non-GAAP financial measures exclude significant items that are generally not related to our ongoing business activities, are infrequent in nature, or both. PGE believes that excluding the effects of these items provides an alternative measure of the Company’s comparative earnings per share and enables investors to evaluate the Company’s operating financial performance trends, exclusive of items that are not normally associated with ongoing operations. Management utilizes non-GAAP measures to assess the Company’s current and forecasted performance, and for communications with shareholders, analysts and investors. Non-GAAP financial measures are supplementary information that should be considered in addition to, but not as a substitute for, the information prepared in accordance with GAAP. Items in the periods presented, which PGE believes impact the comparability of comparative earnings and do not represent ongoing operating financial performance, include the following: 2026: Business transformation and optimization expenses, including strategic advisory, workforce realignment and corporate structure update costs; acquisition costs, including legal, financing and strategic advisory costs; Non-cash charge related to final orders on the January 2024 storm and damage and 2024 Reliability Contingency Event regulatory deferrals 2025: Business transformation and optimization expenses, including strategic advisory, workforce realignment and corporate structure update costs Due to the forward-looking nature of PGE’s non-GAAP adjusted earnings guidance, and the inherently unpredictable nature of items and events which could lead to the recognition of non-GAAP adjustments (such as, but not limited to, regulatory disallowances or extreme weather events), management is unable to estimate the occurrence or value of specific items requiring adjustment for future periods, which could potentially impact the Company’s GAAP earnings. Therefore, management cannot provide a reconciliation of non-GAAP adjusted earnings per share guidance to the most comparable GAAP financial measure without unreasonable effort. For the same reasons, management is unable to address the probable significance of unavailable information. PGE’s reconciliation of non-GAAP earnings for the three months ended September 30, 2026, June 30, 2026, March 31, 2026, June 30, 2025, September 30, 2025 and December 31, 2025 are on the following slide. Non-GAAP financial measures
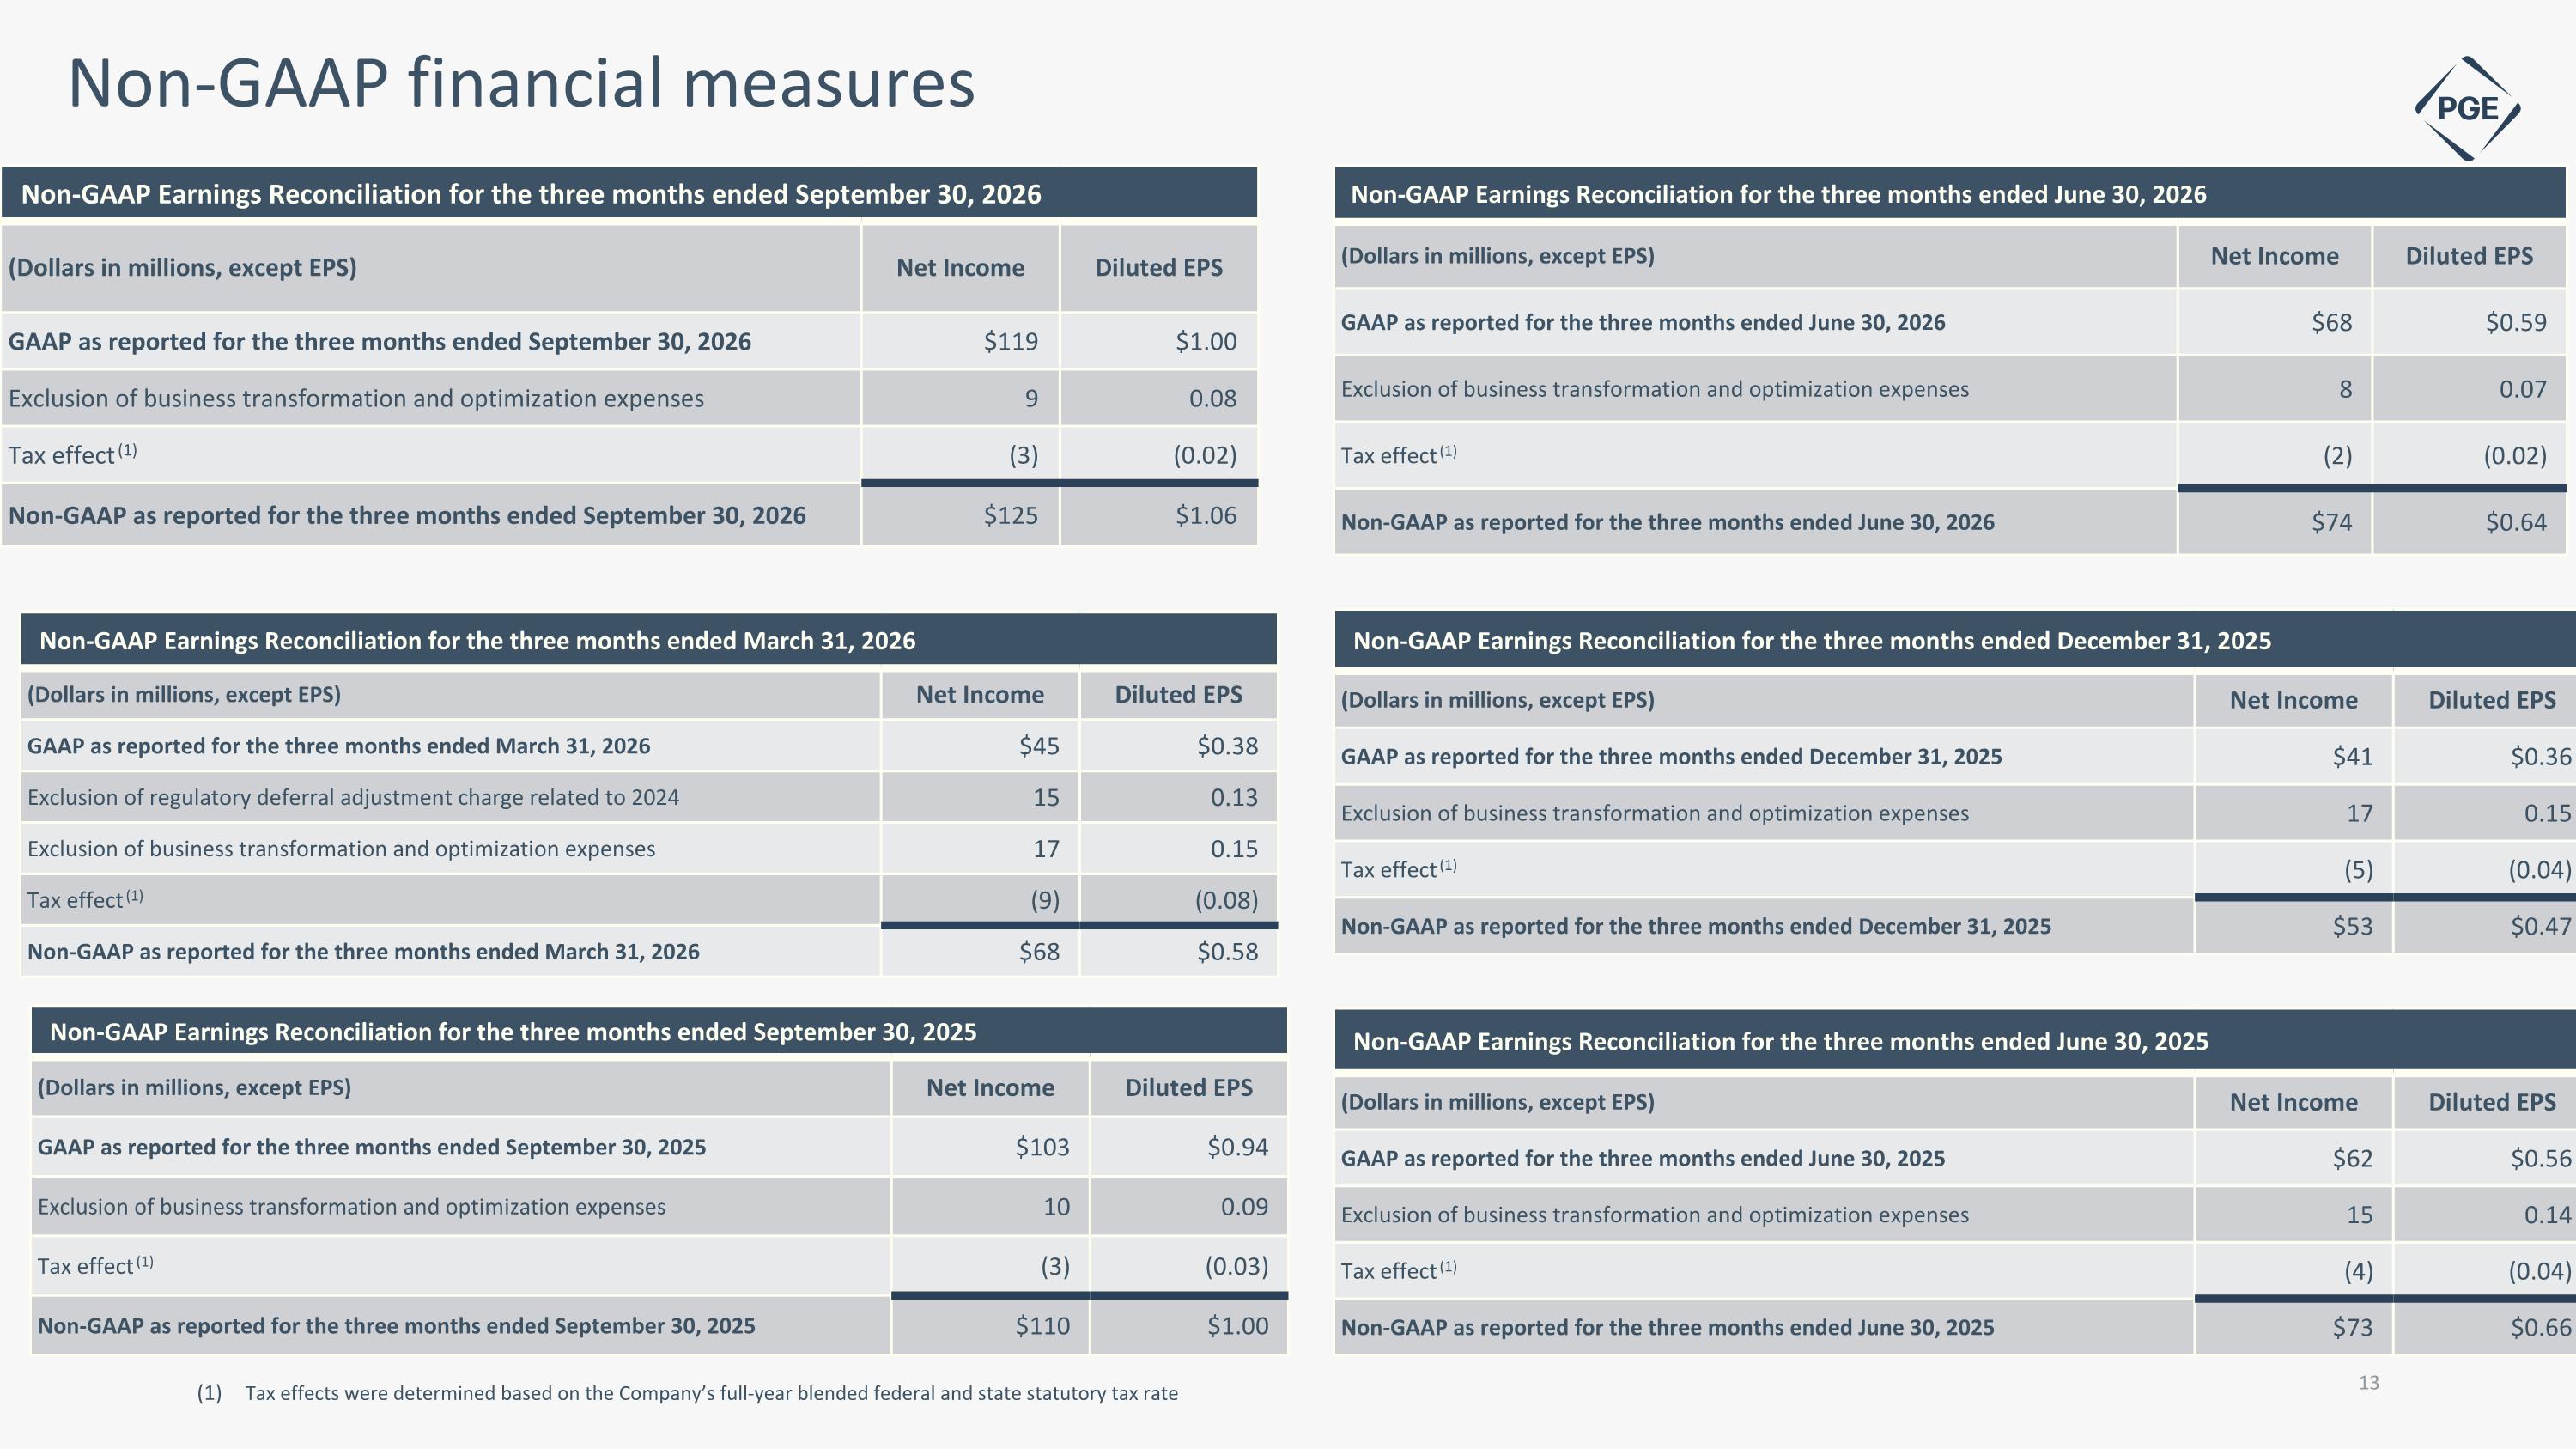
Non-GAAP Earnings Reconciliation for the three months ended March 31, 2026 (Dollars in millions, except EPS) Net Income Diluted EPS GAAP as reported for the three months ended March 31, 2026 $45 $0.38 Exclusion of regulatory deferral adjustment charge related to 2024 15 0.13 Exclusion of business transformation and optimization expenses 17 0.15 Tax effect (1) (9) (0.08) Non-GAAP as reported for the three months ended March 31, 2026 $68 $0.58 Non-GAAP financial measures Tax effects were determined based on the Company’s full-year blended federal and state statutory tax rate Non-GAAP Earnings Reconciliation for the three months ended June 30, 2025 (Dollars in millions, except EPS) Net Income Diluted EPS GAAP as reported for the three months ended June 30, 2025 $62 $0.56 Exclusion of business transformation and optimization expenses 15 0.14 Tax effect (1) (4) (0.04) Non-GAAP as reported for the three months ended June 30, 2025 $73 $0.66 Non-GAAP Earnings Reconciliation for the three months ended December 31, 2025 (Dollars in millions, except EPS) Net Income Diluted EPS GAAP as reported for the three months ended December 31, 2025 $41 $0.36 Exclusion of business transformation and optimization expenses 17 0.15 Tax effect (1) (5) (0.04) Non-GAAP as reported for the three months ended December 31, 2025 $53 $0.47 Non-GAAP Earnings Reconciliation for the three months ended September 30, 2025 (Dollars in millions, except EPS) Net Income Diluted EPS GAAP as reported for the three months ended September 30, 2025 $103 $0.94 Exclusion of business transformation and optimization expenses 10 0.09 Tax effect (1) (3) (0.03) Non-GAAP as reported for the three months ended September 30, 2025 $110 $1.00 Non-GAAP Earnings Reconciliation for the three months ended June 30, 2026 (Dollars in millions, except EPS) Net Income Diluted EPS GAAP as reported for the three months ended June 30, 2026 $68 $0.59 Exclusion of business transformation and optimization expenses 8 0.07 Tax effect (1) (2) (0.02) Non-GAAP as reported for the three months ended June 30, 2026 $74 $0.64 Non-GAAP Earnings Reconciliation for the three months ended September 30, 2026 (Dollars in millions, except EPS) Net Income Diluted EPS GAAP as reported for the three months ended September 30, 2026 $119 $1.00 Exclusion of business transformation and optimization expenses 9 0.08 Tax effect (1) (3) (0.02) Non-GAAP as reported for the three months ended September 30, 2026 $125 $1.06
